Maptitude 2026 is professional, easy-to-use desktop and online mapping software for sales territory management, routing, demographics, and site selection. New in 2026: faster territory tools with right-click bulk reassignment, four new PDF routing reports, October 2025 HERE® street data, 2024 ACS demographics, 5-year population projections through 2054, an AI-powered Get Data wizard in Maptitude Online, and map panning over imagery that is up to 5.8 times faster than Maptitude 2025. Maptitude runs on Windows desktop or in any browser, and can run fully offline. Starts at US$795.
|
Maptitude 2026
is here! |
|
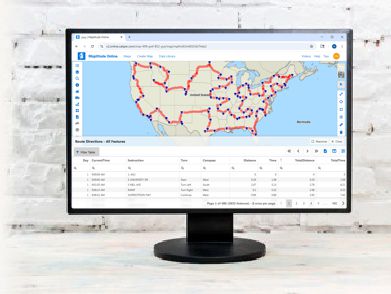
Maptitude 2025 |
 |
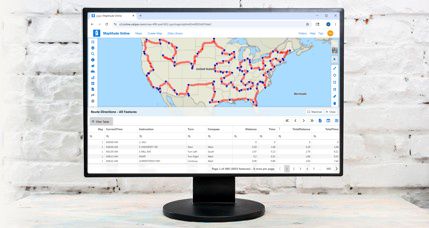
Maptitude 2026 is the fastest, easiest-to-use professional mapping application yet, with significant enhancements to sales territory management, sharing, visualizations, and logistics and operations analytics.
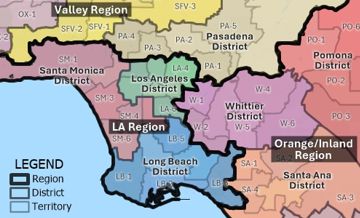
| New Territory Tools | Right-click bulk reassignment, faster territory creation on large datasets, hover to see the full territory hierarchy, active territory moves to the top of the list |
| New Routing and Reports | Four new PDF direction report formats, direction-of-travel route style, avoid specific streets and street types (ferries, truck-restricted), U-turn prevention |
| Faster Map Drawing | Up to 5.8x faster panning with imagery (uncached) compared to Maptitude 2025 |
| New Street Data | October 2025 HERE® (U.S. and major international), plus a January 2026 ZIP Code update |
| New Demographics | 2024 American Community Survey, down to Census Block Group |
| New Projections | 5-year population projections through 2054 |
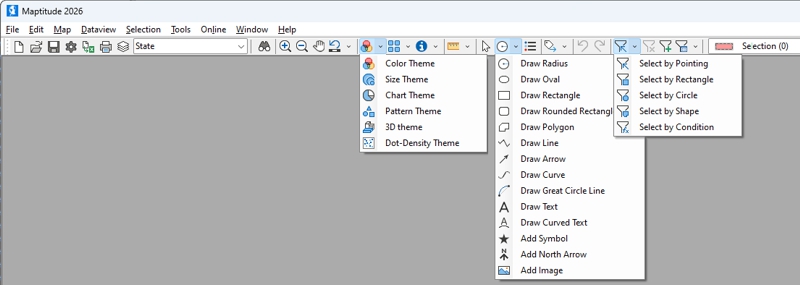
| Refreshed Interface | Simplified Ribbon toolbar with Microsoft Fluent Design icons |
| Updated Help | New browser-based Help, 24/7 AI chat assistant in the Learning Portal, and updated tutorials |
| New in Maptitude Online | AI-powered Get Data wizard, multi-stop routing, clustered pie and bar chart themes, lasso and shape-based territory selection, cumulative drive-time rings, side-by-side map and data view |

|
“Even though I only use it on occasion, I can always pick right back up where I left off. After you learn it, it gets easy to use. I tried other solutions but Maptitude was always the best. The cost is good compared to other solutions.”
|

|
“The overall experience is very good, with the tools and features and plug-ins, the majority of logistics analysis projects can be executed. The user interface, offer[s] tools and features that are only a few clicks away with excellent inbuilt support pages and examples.”
|
 Check out our G2 Reviews
Managing territories just got a lot faster. Maptitude 2026 speeds up the whole process:
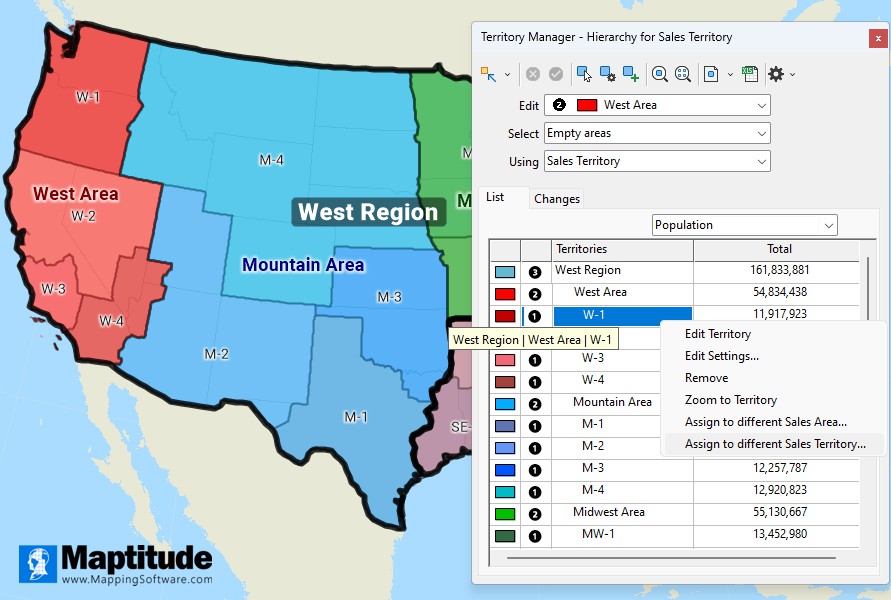
Maptitude 2026 reassigns areas between sales territories with one right-click, keeping the active territory at the top of a population-balanced Region → Area → Territory hierarchy
Maptitude 2026 gives you more control over routes and makes them easier to share.
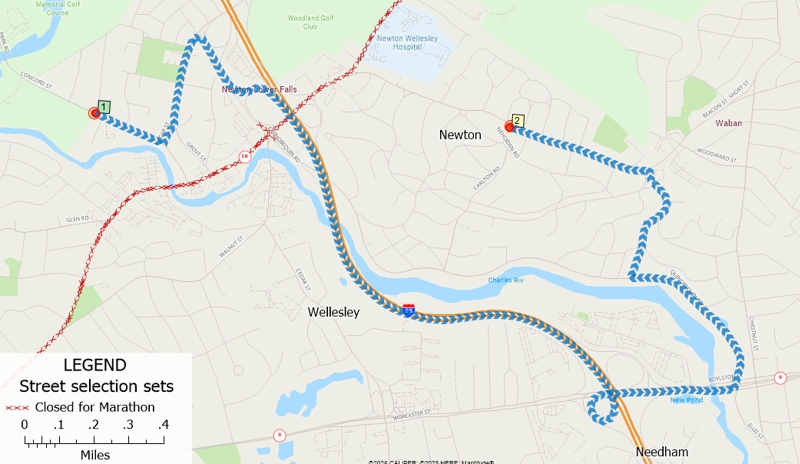
Find routes that avoid ferries, roads with vehicle prohibitions, or closed roads
Your maps are only as good as your data. Maptitude 2026 keeps you current with:
Maptitude 2026 has a rebuilt drawing engine. The biggest gains show up on large maps with satellite or aerial imagery and on maps with many layers. In our internal benchmarks, with the same maps and the same hardware in Maptitude 2025 and Maptitude 2026:
| Operation | Maptitude 2025 | Maptitude 2026 | Faster By |
|---|---|---|---|
| Pan large map with imagery (uncached tiles) | 11.29 s | 1.96 s | 82.7% (5.8x) |
| Redraw large map with imagery | 2.79 s | 1.94 s | 30.3% |
| Redraw multi-layer map with theme | 3.04 s | 2.67 s | 12.1% |
| Pan large map with imagery (cached tiles) | 2.27 s | 2.00 s | 11.9% |
| Redraw small map with imagery | 0.96 s | 0.92 s | 4.2% |
| Basic map redraw (no theme, no imagery) | 2.04 s | 2.00 s | 2.0% |
Internal benchmarks, average of 4 to 5 runs each on the same hardware. The largest speedups show up with imagery and many layers. Simple maps were already near-instant in both versions.
What's behind the speedup:
Maptitude 2026 has a cleaner, more modern look. Long-time users will feel right at home.
Getting started with Maptitude 2026 is easier than ever:
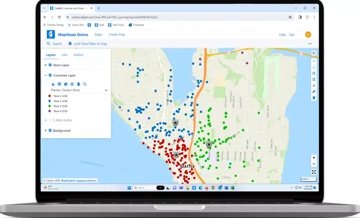
Maptitude Online works in any browser. There is no desktop install. New for 2026:
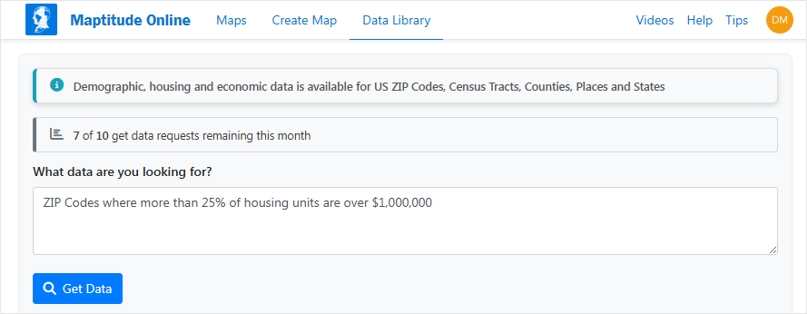
The AI Data Library in Maptitude Online lets users ask plain-English demographic questions without knowing variable names.
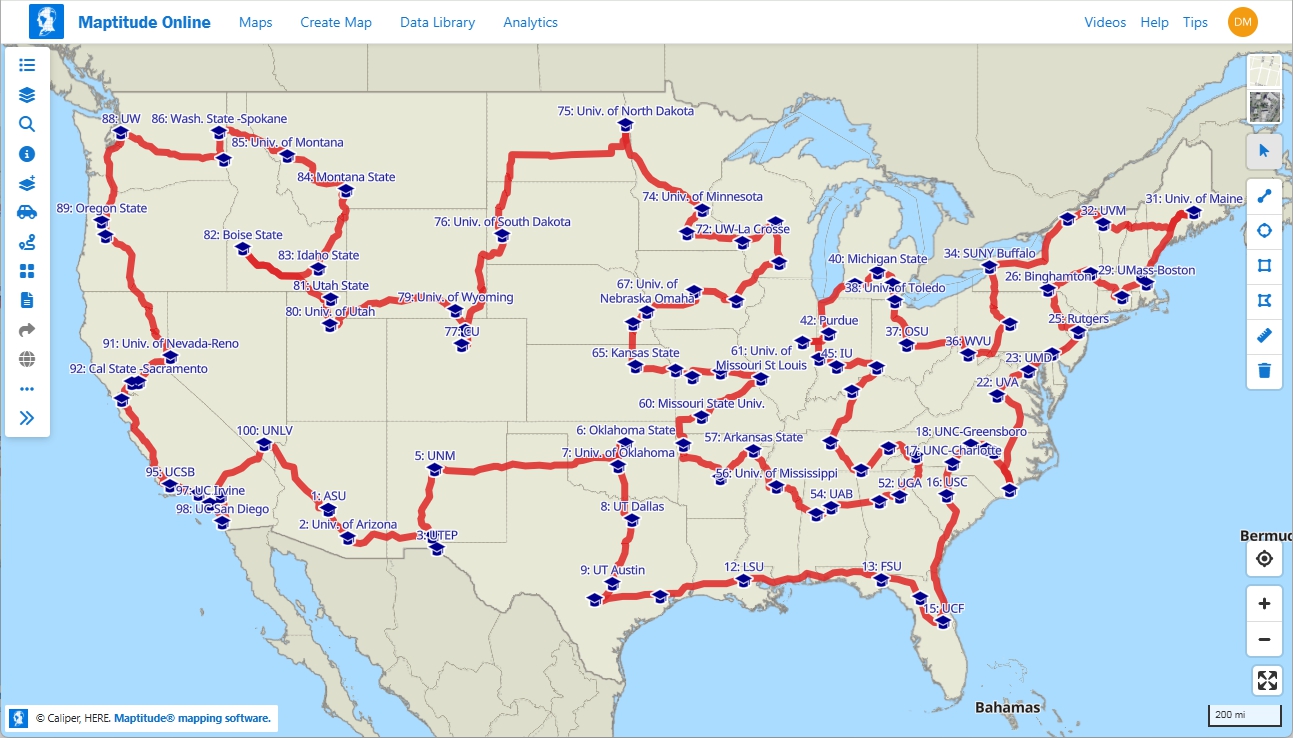
Maptitude Online supports routes with up to 100 stops.
Maptitude 2026 includes faster territory creation with right-click bulk reassignment, four new PDF routing reports, October 2025 HERE® street data, 2024 ACS demographics, 5-year population projections through 2054, map panning over imagery that is up to 5.8 times faster than Maptitude 2025, a refreshed Simplified Ribbon interface with Microsoft Fluent Design icons, updated help resources, and new AI-powered tools in Maptitude Online.
You can now right-click to bulk reassign areas between territories. Territory creation is faster on large datasets. Linked record updates are faster through SQLite. The active territory automatically moves to the top of the Territory Manager. A hover tooltip shows the full territory hierarchy.
Maptitude 2026 adds four new PDF direction report formats, a direction-of-travel route style, the ability to avoid specific streets or street types such as ferries, and U-turn prevention in delivery routing.
In internal benchmarks on the same hardware, Maptitude 2026 pans large maps with uncached imagery about 5.8 times faster than Maptitude 2025 (1.96 seconds versus 11.29 seconds on average). Large map redraws with imagery are about 30 percent faster. Multi-layer themed maps redraw about 12 percent faster. Basic maps without imagery or themes were already near-instant in both versions.
The U.S. Country Package includes October 2025 HERE® streets, a January 2026 ZIP Code update, 2024 ACS demographics down to the Census Block Group, and new 5-year population projections from 2029 through 2054. All major international Country Packages also get the October 2025 HERE® update.
Maptitude Online adds an AI-powered Get Data wizard, multi-stop routing, clustered pie and bar chart map themes, lasso and shape-based territory selection, cumulative drive-time rings, database filtering, and a side-by-side map and data table view, all in your browser. Direct upload of Google Sheets and support for Salesforce Objects are both coming to Maptitude Online later in 2026.
Maptitude 2026 starts at US$795 for a 10-year license that includes the full U.S. Country Package. Subscription pricing and more international Country Packages are also available.
Maptitude is built to be professional but easy to learn. Maptitude 2026 adds a Simplified Ribbon toolbar with Microsoft Fluent Design icons, a 24/7 AI chat assistant in the Learning Portal, a new browser-based Help system, and updated tutorials and videos. Customers regularly cite the short learning curve and the number of clicks saved on common tasks.
Maptitude is professional mapping software at an unbeatable price, just US$795 for desktop or Maptitude Online. See pricing, visit the Mapping Software Store, email us, or call +1 617-527-4700.
The latest version of Maptitude means the most accurate data and the best tools, available today.
Home | Products | Contact | Secure Store