

Authors:
Max Bahar,
Stewart Berry, and Dan Martin
25 August 2023
In today's fast-paced world, businesses are constantly seeking ways to streamline their site selection process. One critical aspect is identifying the best intersections that align with specific demographic criteria. Maptitude, a powerful business mapping software, offers automation routines and tools that enable businesses to quickly screen every intersection in a metro area for their desired demographic characteristics in a cost-effective manner. In this article, we will use the robust features in Maptitude mapping software to walk you through the steps to find the best intersection for your new site location.
Real estate professionals can greatly benefit from the ability to quickly screen intersections for specific demographic criteria using Maptitude. By efficiently analyzing demographic data at the intersection level, real estate professionals can identify prime locations for various property types, such as residential, commercial, or mixed-use developments. They can gain insights into factors like median household income, population growth, and owner-occupied housing, which are crucial in determining the potential demand and profitability of a property. Additionally, industries such as retail, hospitality, healthcare, and transportation can also leverage this capability to identify strategic locations for their businesses, optimize service coverage, and target specific customer segments. Maptitude enables a fast and cost-effective screening process allowing these industries to make data-driven decisions and maximize their chances of success in a competitive market.
For example, when it comes to selecting the perfect retail site for a sandwich shop franchise like Jon Smith Subs, strategic decisions are crucial, and mapping software can be an invaluable tool in this process. By leveraging mapping software, franchises can ensure that their site requirements are met with precision and accuracy. Their site requirements, which encompass an active trade area within a 5-minute drive time, above-average daytime and residential density, as well as a favorable median income range, reflect their commitment to optimal site selection. Additionally, the emphasis on ideal traffic counts ranging from 30,000 to 50,000 VPD (vehicles per day) demonstrates their understanding of the importance of visibility and accessibility.
Drawing inspiration from Wendy's, another established franchise, the significance of real estate site criteria such as residential population and daytime population thresholds is evident. The median income range of $40,000 to $75,000, along with substantial traffic counts exceeding 20,000, further highlights the shared emphasis on capturing a robust customer base. The preference for strong access and proximity to high-energy retailers underscores the strategic thinking required for optimal site placement. The stipulation of being at least 2 miles away from existing Wendy's locations reveals a meticulous approach to market saturation.
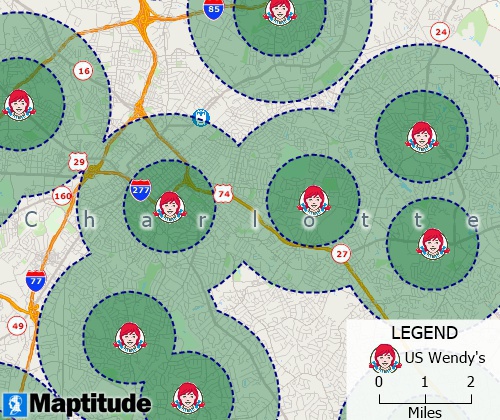
Maptitude maps Wendy's locations and many other chains and points of interest
Both Jon Smith Subs and Wendy's recognize that the interplay of demographics, traffic patterns, and retail dynamics are pivotal, and the utilization of mapping software can empower any organization to make informed choices that drive success.
Step 1: Prepare a map
Step 2: Select relevant streets
(ccStyle <> 30) and (ccStyle <> 40) and (ccStyle <> 41) and (ccStyle <> 50) and (ccStyle <> 55)
Step 3: Select intersections connected to the relevant streets
ArrayLength(GetNodeLinks(ID)) > 2
Step 4: Calculate demographics for the selected intersections
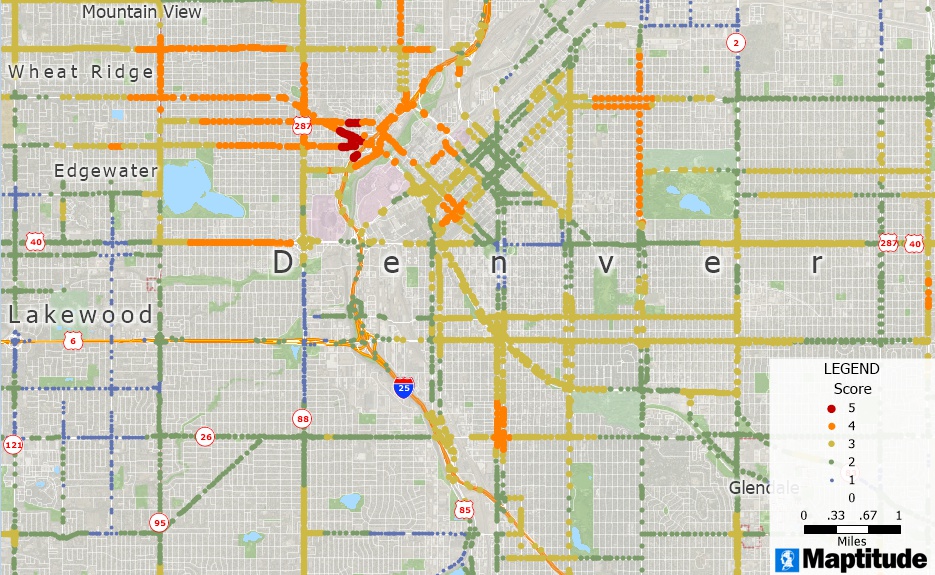
Step 5: Use a formula field to calculate scores
To determine the best intersections based on specific demographic criteria, you can assign scores using a formula field. For example, we want to score intersections based on the following criteria:
(If [Estimated Median HH_Income] > 70000 then 1 else 0) + (If [Estimated % Change in Median HH_Income] > 0.10 then 1 else 0) + (If Population > 5000 then 1 else 0) + (If [% Change in Population] > 0.1 then 1 else 0) + (If [Owner occupied] / Households > 0.2 then 1 else 0)
Step 6: Visualize the scores with a color theme
Step 7: Clean up the map
You may want to make several cosmetic changes to the map. For example:
The powerful automation routines and tools in Maptitude make it possible to quickly screen every intersection in a metro area for specific demographic criteria. By following the steps outlined in this article, businesses can efficiently process large amounts of data, saving valuable time and resources during the site selection process. You could further screen intersections to exclude those that are close to other stores or you could use the free Annual Average Daily Traffic data to evaluate intersections based on traffic count requirements. For more information on incorporating traffic data in your analysis, see How do I use AADT traffic count data with my locations.
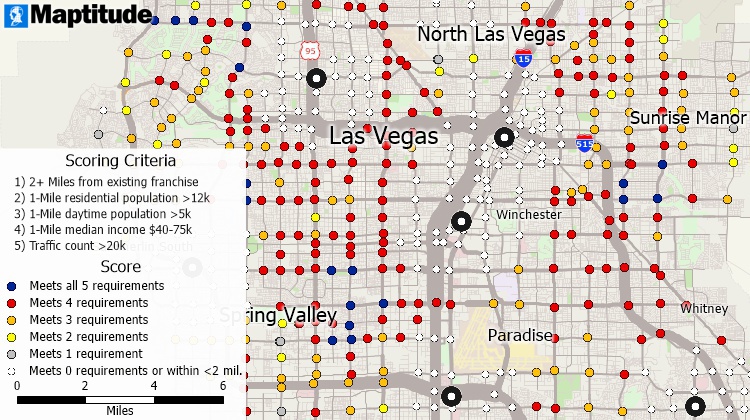
Intersections within 2 miles of an existing store are excluded from scoring in this analysis that also considers nearby streets with a minimum traffic count of 20,000
In addition, the drive-time rings, demographic analysis, formula fields, and thematic mapping features in Maptitude enable businesses to make informed decisions based on their unique requirements.
Learn more about Maptitude to see how you and your team can benefit from mapping software!
Schedule a Free Personalized Demo
 Check out our G2 Reviews