Author:
Tracy Horgan
We use mapping software to analyze the Georgia results of the 2020 US Presidential Election by vote method.
The COVID-19 pandemic in 2020 prompted many states to enact new safety measures to protect voters, such as requiring masks, providing hand sanitizer, and expanding the number of polling places. Many states also increased the number of mail-in voting options, enabling more citizens to exercise their right to vote from the comfort of their homes. According to ABC News,1 at least thirty states modified voting rules to make the election more accessible for voters. As a result, presidential election turnouts and nontraditional voting methods were record-breaking2.
The results of the 2020 presidential election were contentious in several states including Arizona, Wisconsin, and Georgia. The perception of the role of expanded voting methods contributed to President Trump requesting recounts3 in all three states, as well as a direct request from Trump to Georgia’s Secretary of State, Brad Raffensperger, to find any missing votes4.
To explore these issues, we downloaded election results5 data from the Georgia Secretary of State’s website. The data are from the December 7th (2020) recount and include total registered voters and vote method by voters for each county. In the 2020 presidential election, Georgia expanded its voting to four methods: absentee by mail, advance voting, election day, and provisional.
We first used Maptitude mapping software to map election results to county boundaries.
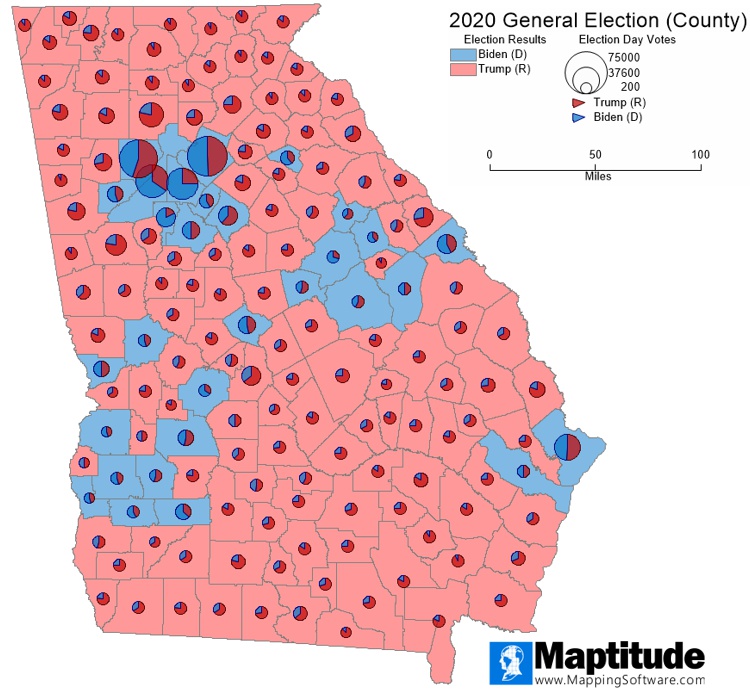
Comparison of winning candidate for the county with election day votes cast for each candidate (Click for interactive map)
Next, we used a color theme on the counties according to the party of the candidate with the most votes. We then overlaid the counties with map charts depicting election day votes by candidate using the same range of colors. We can see right away that more in-person votes were cast for Trump on election day than for Biden. We found that 60.29% of votes cast in-person on election day were for Trump. Trump encouraged his supporters to vote in person rather than relying on less traditional no-contact methods of voting.
In previous election cycles, these numbers would suggest that Trump would win the election. Our analysis of the relationship between election day voting and presidential winner shows that no correlation between the two exists.
In our next map, the counties retain the same color theme used in the previous example. We then overlaid map charts for counties in this map with early voting methods by candidate.
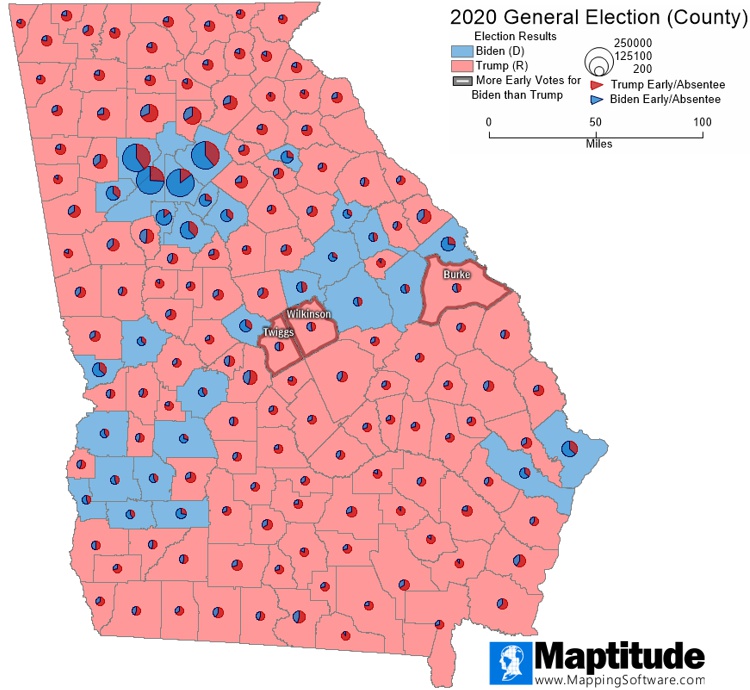
Comparison of winning candidate for the county with early voting votes cast for each candidate; counties where the winning candidate differed from the highest number of early votes are outlined (Click for interactive map)
In most counties, the distribution of early votes by candidate matches the winning candidate for the county. Only three counties (Burke, Twiggs, and Wilkinson) are outliers, with Biden having more early votes than Trump, while Trump won the county.
The considerable number of advance votes for both candidates is notable, though Biden supporters cast far more absentee votes than did Trump supporters. The outcome of the early voting results closely correlates with the presidential winner.
In the previous two comparisons, we saw that most election day votes were cast for Trump and there was high advance voting participation for both candidates. Seeing all the counties shaded red on both maps might lead to the conclusion that Trump won Georgia. However, it is vital to understand the distribution of registered voters in Georgia to establish context.
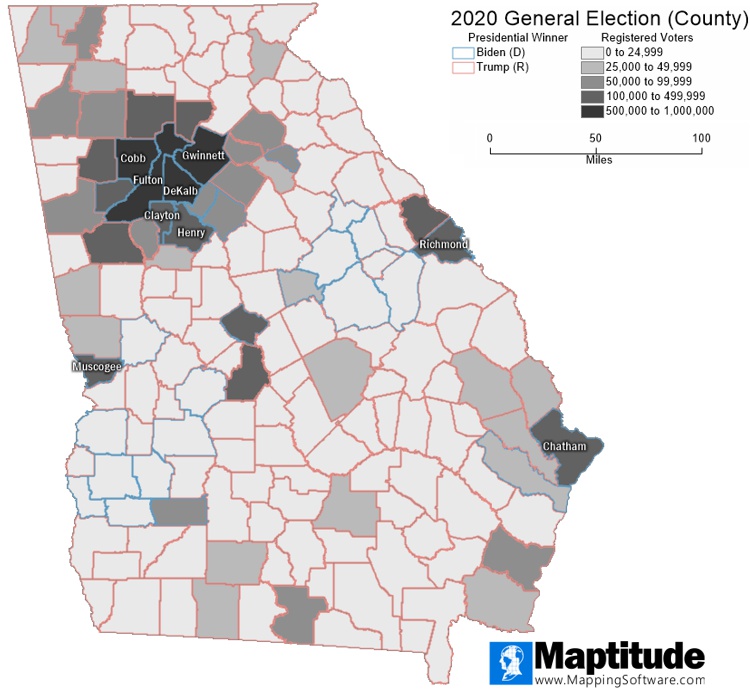
County boundaries colored by the winning candidate and filled with the number of registered voters (Click for interactive map)
This map shows the registered voters in each county overlaid with the winning candidate. Nine of the eleven counties with more than 130,000 registered voters voted for Biden. The nine counties voting Democrat in the 2020 presidential election comprise 47.02% of the registered voters statewide. The remaining two counties, Cherokee and Forsyth, comprise only 5% of the registered voters.
While only 31 of 159 counties in Georgia declared Biden as the winner, the number of votes in those counties brought the total vote count for Biden and Trump within 11,779 votes statewide.
| Candidate | Election Day Votes | Absentee by Mail Votes | Advance Voting Votes | Provisional Votes | Total Votes |
| Biden (D) | 373,530 | 848,726 | 1,244,988 | 6,389 | 2,473,633 |
| Jorgensen (L) | 20,719 | 16,046 | 25,255 | 209 | 62,229 |
| Trump (R) | 598,458 | 450,522 | 1,409,331 | 3,543 | 2,461,854 |
| 992,707 | 1,315,294 | 2,679,574 | 10,141 | 4,997,716 |
Candidates by Vote Type (December 7, 2020 Recount)
The election's outcome was probably influenced by several factors, including COVID-19, the ballot proposals that were on the ballot, and voter turnout. Therefore, it is impossible to make a solid conclusion only based on election return data. It appears that advance voting contributed to the result of the 2020 Georgia Senate elections. Mapping Software is a valuable tool to map data and test various geographic hypotheses.
1ABC News Network. (n.d.). ABC News.
Retrieved January 6, 2023, from
https://abcnews.go.com/Politics/states-changed-rules-voting-amid-coronavirus-pandemic/story?id=72309089
2 Bureau, U. S. C. (2022, February 22).
Census Bureau releases 2020 Presidential Election Voting Report.
Census.gov. Retrieved January 6, 2023, from
https://www.census.gov/newsroom/press-releases/2022/2020-presidential-election-voting-report.html
3 Schwab, H., Baccaglini, B., Simkovits,
M., Pyatt, M., Zerbe, A., Hufford, A., Freeman, E., Middleton, C.,
Wan, C., Bloomgarden, A., & Jensen, G. (n.d.). (publication). Vote
Recounts and Election Contests in Battleground States.
https://web.mit.edu/healthyelections/www/sites/default/files/2021-06/Recounts_Contests_Battleground_States.pdf
4 Michael. (2021, January 3). Trump, in
taped call, pressured Georgia official to 'find' votes to overturn
election. The New York Times. Retrieved January 9, 2023, from
https://www.nytimes.com/2021/01/03/us/politics/trump-raffensperger-call-georgia.html
5 List elections - SCYTL. (n.d.).
Retrieved January 5, 2023, from
https://results.enr.clarityelections.com/GA/
Learn more about Maptitude to see how you and your team can map the best locations for your business!
Schedule a Free Personalized Demo