

The U.S. Census Bureau keeps track of geographic boundaries for tabulation purposes. In addition to political boundaries such as states and counties, the Census Bureau also creates smaller levels of geography so that data can be tabulated to smaller units. The smallest units are census blocks, followed by block groups and census tracts. The diagram to the right illustrates the hierarchical relationship of these smaller census summary levels.
Below are more detailed descriptions for all of the summary levels for which the Census Bureau tabulates data. All of these census summary levels are available for Caliper mapping software products and include 2020 Census data and most include the latest American Community Survey (ACS) data. Caliper also offers 1990 Census data, 2000 Census data, and 2010 Census data.
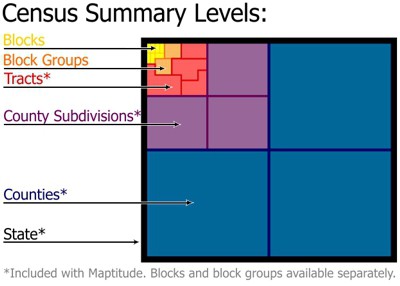
The following summary levels have a hierarchical relationship (reflected in their summary level codes) and are listed from smallest to largest:
 What Are Blocks?
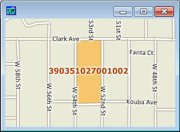
Blocks are the smallest entity for which the Census Bureau collects
and tabulates census information. There are about 8
million census blocks nationwide as of the 2020 Census. In cities, a
census block is typically equivalent to a city block bounded by
streets on all sides. In rural areas, however, a census block may be
larger and bounded by streets, streams, railroad tracks, city
limits, or county boundaries.
Available separately from Caliper
 What Are Block Groups?
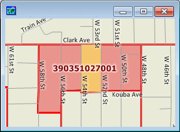
The Block Groups layer contains a nationwide
area database with 242,180 Census Block Groups with Census and
American Community Survey (ACS) demographic data. Block Groups are a
combination of Census Blocks and are also a subdivision of Census
Tracts. Block Groups generally contain between 600 and 3000 people
and are made up of on average 40 Census Blocks.
Available separately from Caliper
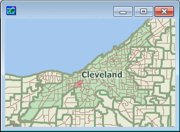
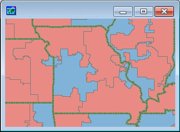
 What Are Tracts?
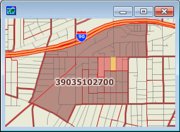
Tracts are a small, relatively permanent statistical subdivision of a
county delineated by a local committee of census data users for the
purpose of presenting census data. Census tract boundaries normally
follow visible features, but may follow governmental unit boundaries and
other non-visible features, and they always nest within counties. Census
tracts are designed to be relatively homogenous units with respect to
population characteristics, economic status, and living conditions at
the time the users established them. They usually contain 1,200 to 8,000
people and are made up of on average about four block groups. There are
about 85,193 tracts nationwide as of the 2020 Census. The census tract
layer included with Maptitude is ideal for
demographic
mapping and for estimating the demographics of territories or around
sites.
Included with Maptitude and TransCAD
 What Are County Subdivisions?
County subdivisions are the primary divisions of counties for the
reporting of decennial census data. They include minor civil divisions
(MCDs are the primary governmental or administrative divisions of a
county such as boroughs, towns, and townships), census county divisions
(CCDs were established by the Census Bureau in 21 states where there are
no legally established MCDs), census subareas, and unorganized
territories.
Included with Maptitude and TransCAD
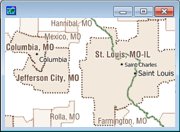
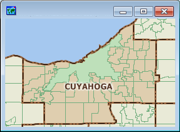 What Are Counties?
Counties are the primary legal divisions of most states. In
Louisiana, these divisions are known as "parishes." In Alaska, which has
no counties, the statistically equivalent entities are census areas,
city and boroughs (Juneau City and Borough), a municipality (Anchorage),
and organized boroughs. In Connecticut, which has had no
county governments since 1959, the statistically equivalent
entities are Council of Government (COGs)/planning regions. The entire District of Columbia is considered
equivalent to a county for statistical purposes. The primary legal
divisions of Puerto Rico are termed "municipios" and are treated by the
U.S. Census Bureau, for statistical purposes, as the equivalent of a
county in the United States. The County layer included with Maptitude is
ideal for
demographic mapping of county data.
Included with Maptitude and TransCAD
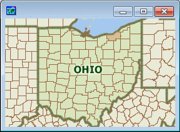 What Are States?
States are the primary governmental divisions of the United States.
The District of Columbia is treated as a statistical equivalent of a
state for decennial census purposes, as are Puerto Rico and the Island
Areas: American Samoa, Guam, the Commonwealth if the Northern Mariana
Islands, and the Virgin Islands of the United States.
Included with Maptitude and TransCAD
In addition to the hierarchical summary levels listed above, there are a number of additional summary levels for which the Census Bureau tabulates data. These include:
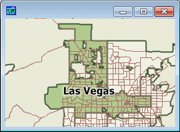 What Are Census Places?
Places include census designated places, consolidated cities, and
incorporated places. A Census designated place is a settled
concentration of population that are identifiable by name but are not
legally incorporated under the laws of the state in which they are
located. Consolidated cities are where an incorporated place and its
county or minor civil division (MCD) have merged. Incorporated places
are those reported to the U.S. Census Bureau as legally in existence on
January 1, 2020, under the laws of their respective states, as cities,
boroughs, towns, and villages, with the following exceptions: the towns
in the New England states, New York, and Wisconsin, and the boroughs in
New York are recognized as minor civil divisions for statistical
purposes; the boroughs in Alaska are county equivalents for decennial
census statistical presentation purposes. In four states (Maryland,
Missouri, Nevada, and Virginia), there are one or more incorporated
places known as "independent cities" that are primary divisions of a
state and legally not part of any county. For statistical purposes, the
U.S. Census Bureau may treat an independent city as a county equivalent,
county subdivision, and place.
Included with Maptitude and TransCAD
 What Are Metropolitan
Statistical Areas (MSAs) and Micropolitan Statistical Areas?
What Are Metropolitan
Statistical Areas (MSAs) and Micropolitan Statistical Areas?Caliper's Core Based Statistical Areas layer contains
Metropolitan Statistical Areas. Metropolitan
Statistical Areas (MSAs) are geographical relatively high population
density geographic regions with close economic ties throughout the area.
Caliper's Core Based Micropolitan Statistical Areas layer contains Micropolitan Statistical Areas.
Micropolitan Statistical Areas are around urban areas with a population
of 10,000 to 49,999. MSAs and Micropolitan Statistical Areas are not
legally incorporated nor are they
legal administrative divisions.
Included with Maptitude and TransCAD
 What Are Congressional Districts?
Congressional districts are the 435 areas from which members are elected
to the U.S. House of Representatives.
Available Separately from Caliper
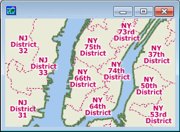 What
Are State Legislative Districts?
What
Are State Legislative Districts?State legislative districts are the areas from which members are elected
to upper (senate) or lower (house/assembly) chambers of the state legislatures.
Available Separately from
Caliper
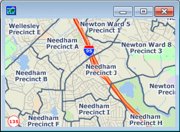 What Are Voting Districts?
Voting districts are areas, such as precincts, wards, and election
districts, established by state, local, and tribal governments for the
purpose of conducting elections.
Available Separately from
Caliper
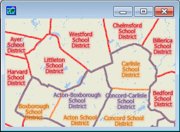 What Are School Districts?
School Districts School districts are geographic entities within which
state, county, or local government officials provide public educational
services for the area's residents.
Available Separately from
Caliper
An urbanized area consists of densely settled territory that contains
50,000 or more people. An urbanized area may contain both place and
non-place territory. The U.S. Census Bureau delineates urbanized areas
to provide a better separation of urban and rural territory, population,
and housing in the vicinity of large places.
Included with TransCAD
Traffic Analysis Zones (TAZs) A traffic analysis zone is a special area
delineated by state and/or local transportation officials for tabulating
traffic-related data and usually consists of one or more census blocks,
block groups, or census tracts.
Included with TransCAD