Whether you're a GIS beginner or a seasoned pro, the video tutorials below can help you take your Maptitude skills to the next level. Learn how to create maps, analyze data, create drive-time rings, find shortest paths, and share your maps online with ease.
Please note, that while most of the videos below use United States data, the functions and capabilities will work with whatever Country Package you have installed.
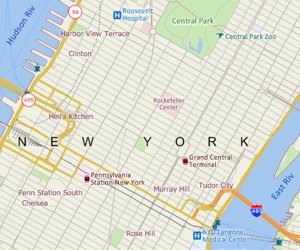


 Creating a General Purpose Map
 Basic Maptitude Concepts
 Creating a Map Using Your Data
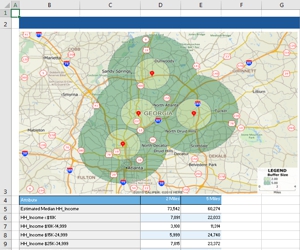
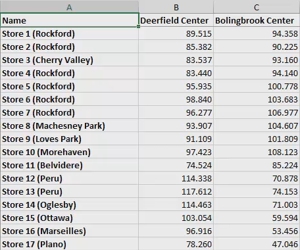
 Using Maptitude with Excel
 Moving Around a Map
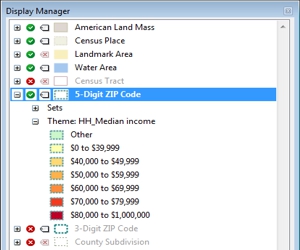
 Using the Display Manager
 Working with Labels
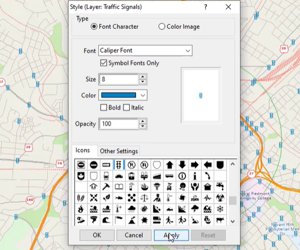
 Working with Styles
 Customizing a Legend
 Using Aerial & Satellite Imagery
 Using Other Geographic File Formats
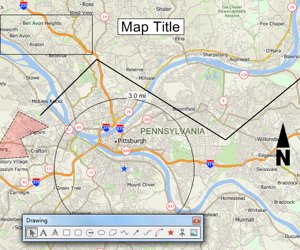
 Using the Drawing Toolbar
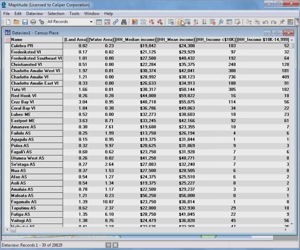
 Working with Data
 Selection Sets (Filters)
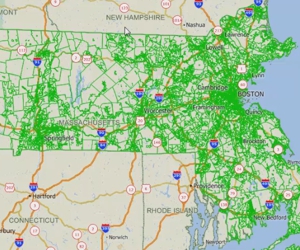
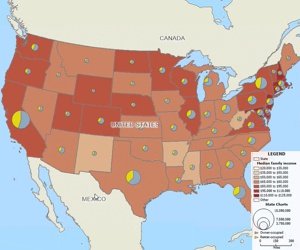
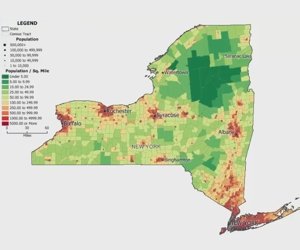
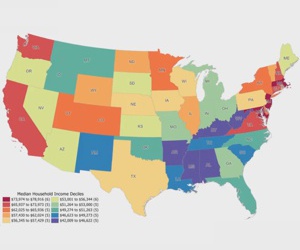
 Creating Thematic Maps
 Attaching Data from Nearby Features
 Joining Your Data to a Map
 Linking and Updating Data
 Creating Overlays & Rings
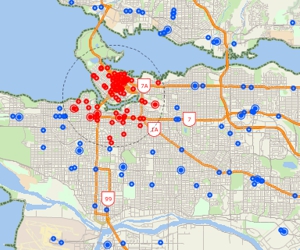
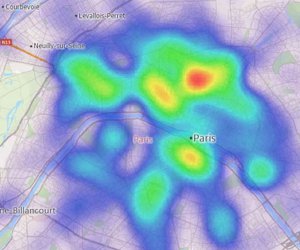
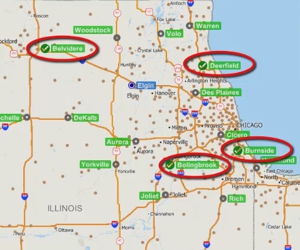
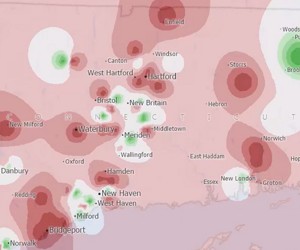
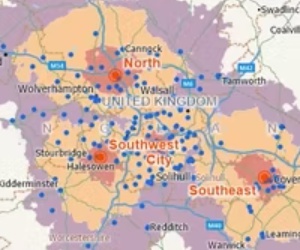
 Creating Hot Spots
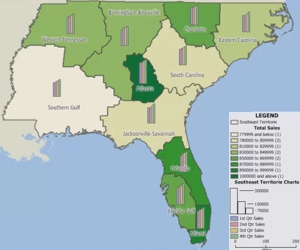
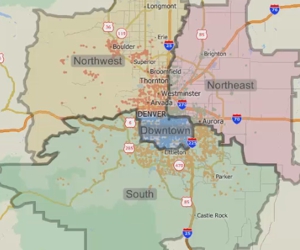
 Creating Territory Layers
 Managing Territory Layers
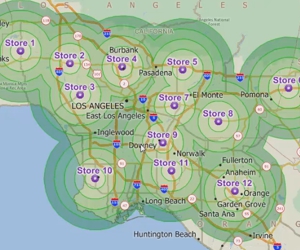
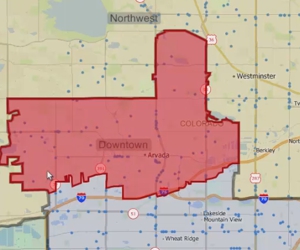
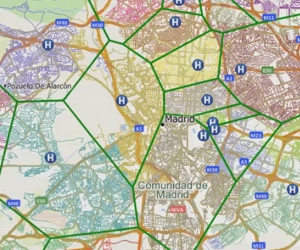
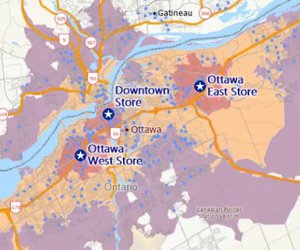
 Influence Areas & Drive-Time Territories
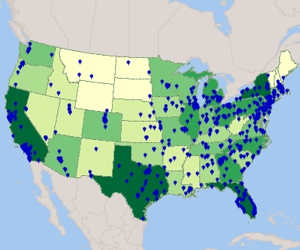
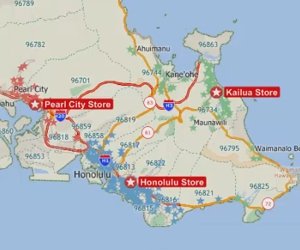
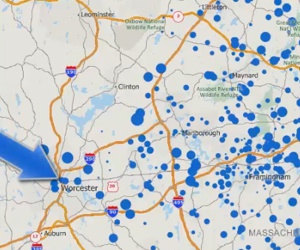
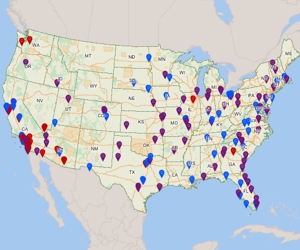
 Creating a Pin Map
 Solving a Facility Location Problem
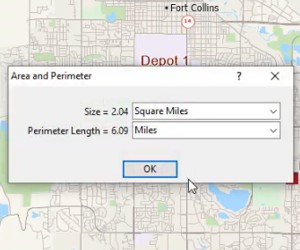
 Measuring Distance & Area
 Calculating Market Share
 Creating Drive-Time Rings
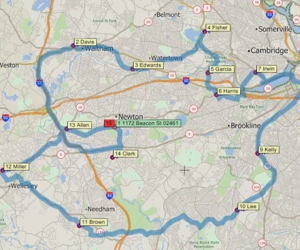
 Finding Shortest Paths & Routes
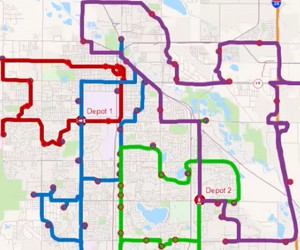
 Vehicle Fleet Routing & Logistics
 Creating Travel Time Tables
 Creating Masks
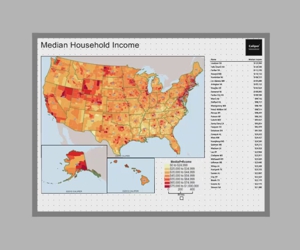
 Creating Layouts
 Saving Maps to Graphics Formats
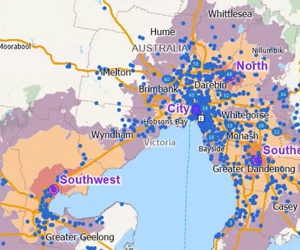
 Using Maptitude with the Australia Country Package
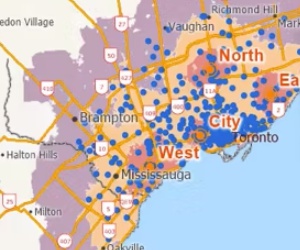
 Using Maptitude with the Canada Country Package
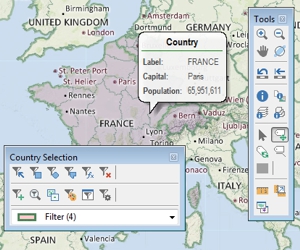
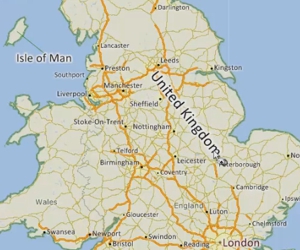
 Using Maptitude with the UK Country Package
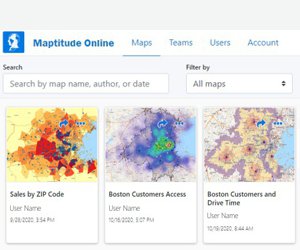
 Sharing with Maptitude Online
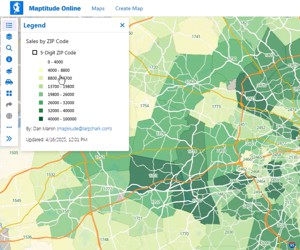
 Mapping Your Data with Maptitude Online