|
Featured Maptitude Maps:
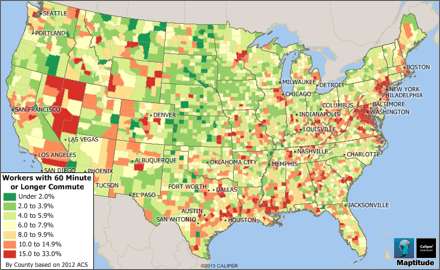
Percentage of People with Commutes of
Over One Hour (By U.S. County)
This map, made with Maptitude 2014,
showcases percentage of workers by US
county with regular daily commutes to
work of over one hour. These travel data
have far-reaching implications for both
employers and workers. All the data used
are available in the USA Country
Package.
|
"Caliper produces the inexpensive Maptitude desktop
GIS package which has extensive GIS-Transportation
functionality".
Professor Nigel M. Waters
|
Maptitude and Transportation: The Daily
Commute
Maps help to
visualize access to a suitable
workforce, which is a significant
location factor for businesses. The
length of the drive to and from work is
an equally important factor for
employees, especially with volatile gas
prices.
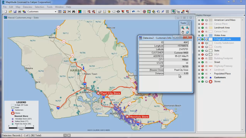
Maptitude 2014 allows
you to map these differences in travel time to work,
average travel time, number of vehicles
per household, and mode of
transportation. These figures
can also be compared to population density, age
distribution, income, education, family size, and
more.
The Maptitude
2014 USA Country Package includes a
wealth of new data such as buying
power/disposable income, health
insurance coverage, FFIEC banking
compliance data,
aggregate/median income by race, and
projections for 2015 and 2020 (more...).
Upgrade to Maptitude 2014 now to access
the latest demographics.
More Featured Maps...
If you would like to see your maps showcased here,
or are interested in
custom map making services and
software please
contact
Caliper.
Focus on Maptitude:
Maptitude is
the Best Mapping Software
Maptitude is competitively priced and
enables organizations and businesses
such as Motorola,
Office Depot,
Panera Bread,
and the U.S. Census Bureau, to
use their location-based data to improve
decision making.
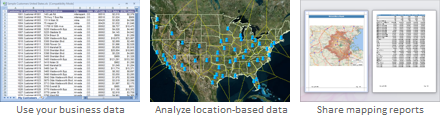
There are many benefits when you use
Maptitude:
√
Quickly see the information and trends
hidden in your geographic data
√
Create 3-D maps, heat maps, territories,
drive-time rings, hot-spots, charts, and
reports
√
Import, analyze, segment, and report on
data in almost any format
√
Map your data for any country in the
world: where available use demographic,
address, zip code, post code, or county
boundary data
√
Use location intelligence to filter and
categorize data
√
Print, export, manage, share, and use
located-based results
√
Contact us via phone and email during
your 60 days of free technical support!
√
Use Maptitude and start seeing better
maps and better results - Now!
The best mapping software. Here's why!
√
Maptitude is the easiest-to-use full
featured mapping software, and includes
powerful tools such as multi-ring
drive-time zones
√
Maptitude has no subscription fees and
supports secure off-line data storage
√
Maptitude provides fully customizable
maps with unlimited point icons
√
Maptitude has unlimited
pin-mapping/geocoding
√
Maptitude includes free mapping data and
demographics covering everything from
population statistics to business
locations, postal/ZIP Codes, and more!
|
What Others Have to Say: |
 Nick
Nicholas Nick
Nicholas
Market
Research Consultant
"The package offers
ease of use, an extensive range
of functions and capabilities,
and a wealth of data. In fact,
if I purchased the data
separately, from any of multiple
sources, the cost for data and
restructuring would be over
$20,000." |
Grant
Ian Thrall
President American Real Estate Society
"Maptitude is easy
to learn. The included
geospatial functionality will
serve most analyst needs. And
the package is available at a
price point that will not
provide a barrier." |
Using Outdated
Data & Technology?
Upgrade to Maptitude 2014!
Users of Maptitude 2013 and Maptitude
2012 can still get our US$395
reduced upgrade pricing. This deal
saves you US$300! Upgrade now to avoid
being caught out by using last year's
features and data.
Also, each US order will include a free US
ZIP Code update: a US$250 value! The
combination of the offer and free data saves
you US$550!
For pricing and ordering information
please visit the
Mapping Software Store, e-mail
Maptitude Sales, or call U.S. Sales
at +1 617-527-4700.
Limited Offer: Valid for Maptitude 2012
or later.
Restrictions Apply.
You need the newest maps, the latest
demographics, and the fastest, most
intuitive Maptitude!
  |
| |
|
Maptitude 2014 Training:
Limited Availability
 New
topics cover Maptitude 2014!
Advance
registration for the instructor-led training courses is required.
Upcoming classes: New
topics cover Maptitude 2014!
Advance
registration for the instructor-led training courses is required.
Upcoming classes:
•
Oct. 20-22: Boston MA
Space is limited, so
register online as soon as possible.
If you have any questions, please call Maptitude
Training (USA) at +1 617-527-4700, or send
an e-mail to
sales@caliper.com.
|
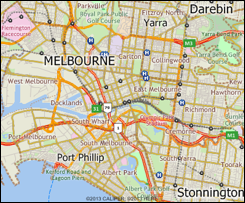
Maptitude International News:
Australia
2014 Country Package Released
Caliper is excited to announce the 2014 Australia
Data Package! The product includes a wealth of data and
functionality not available in any other software.
The Australia data includes an
up-to-date street layer with
address data for geocoding and
travel time information for
computing routes and travel-time
rings. Also included are updated
building footprints for many
urban locations, railroads, and
comprehensive named landmarks
that range from public
facilities to commercial
buildings including shops,
restaurants, and retail stores.
|
|
Did You Know?
One-Click Reporting
Drive-time ring reports are now
accessible via a single click,
allowing direct sharing of your
geographic analysis.

Maptitude 2014 makes it much
easier to create a demographic
report when using the Network
Bands tool. First, create your
desired drive-time or -distance
zones (see
video). These can be for
multiple locations each with
multiple rings. You
can then simply click the button
 in the Network Bands toolbox.
This immediately creates and
opens a default socio-economic
report, without you
first having to perform a
geographic overlay. in the Network Bands toolbox.
This immediately creates and
opens a default socio-economic
report, without you
first having to perform a
geographic overlay.
|
Maptitude
News and Press:
• Enterprise
Apps Today: Geographic Information
Systems Buying Guide
•
African Mining
Brief: Mine Surveying
Technology
•
Maptitude: Better Maps &
Better Results
•
More Maptitude News...
Maptitude
Solutions:
Banking GIS
Business Mapping
Census Data Mapping
Community Development
Election Management
Enterprise GIS
Franchise Mapping
GIS Software
GPS Mapping
Insurance Mapping
Law Enforcement GIS
Location Intelligence
Marketing & Sales Mapping Software
Public Health Mapping
Real Estate Mapping
Redistricting
Route Planning & Deliveries
Satellite & Aerial Imagery
Street Mapping
Territory Mapping
Web Mapping
World Mapping
|
|
Tech Tip:
Choosing
Demographics When Performing Ring
Analysis
Caliper Corporation leads the industry
in the pro cessing
and release of Census data. Since 1995
Maptitude mapping software has made
it easy to access a wealth of Census
data for entire countries. You can
quickly visualize Census demographics
using a suite of wizard-driven tools.
Maptitude also provides a map library
that contains numerous pre-designed maps
listed by Census category. These include
heat maps of demographic, income, and
housing data. The Map Librarian lets you
open one or more of these maps for a
chosen location, allowing you to quickly
analyze Census data for your area of
interest. cessing
and release of Census data. Since 1995
Maptitude mapping software has made
it easy to access a wealth of Census
data for entire countries. You can
quickly visualize Census demographics
using a suite of wizard-driven tools.
Maptitude also provides a map library
that contains numerous pre-designed maps
listed by Census category. These include
heat maps of demographic, income, and
housing data. The Map Librarian lets you
open one or more of these maps for a
chosen location, allowing you to quickly
analyze Census data for your area of
interest.
Unlike many other mapping and GIS
software packages that require users to
purchase data separately, Maptitude
includes demographics so you can start
mapping straight away. In addition to
Census sources, Maptitude includes
extensive non-Census information. These
data, such as Caliper's proprietary
purchasing power estimates, are among
the most accurate available from any
source and significantly more reliable
than U.S. Census data. The included data
alone are worth many multiples of the
software's purchase price.
Maptitude allows you to visualize and
present this information in ways useful
to your organization.
The
following steps illustrate how to choose the fields
shown in a demographic report for time
and distance rings:
-
Choose File-New and use
Create-a-Map Wizard to create a general purpose map
for your area of interest.
-
Choose Tools-Routing-Network Bands
or click
 to display the Network Bands
toolbox. to display the Network Bands
toolbox.
-
Click
 in the Network Bands toolbox to
activate the Click Origin Points tool. in the Network Bands toolbox to
activate the Click Origin Points tool.
-
Click on on the map. Maptitude places symbols
at each of the clicked points.
-
In the Network Bands toolbox choose to create, for example, 3 bands of 5
minutes.
-
Click
 in the Network Bands Toolbox to display the
Network Bands Configuration dialog box and click
Aggregation. in the Network Bands Toolbox to display the
Network Bands Configuration dialog box and click
Aggregation.
-
Change the aggregation methods for those fields you
want to be shown in the report as follows:
Click on the
field in the Fields list; check one or more desired
aggregation options; and type a name for each field
in the Field Name box. (TIP: You can highlight more
than one field at a time and then check a box to
apply the aggregation method to all of the fields at
once.)
-
When you are finished making changes in the Overlay
Attributes dialog box, click OK to close the Overlay
Attributes dialog box, and click OK again to close
the Network Bands Configuration dialog box.
-
Click
 in the Network Bands toolbox.
Maptitude creates the bands and adds them to the map
along with a color theme to illustrate the driving
distances. Any portion of the map that is not
covered by a band is greater than the travel-time
you chose from the clicked locations. in the Network Bands toolbox.
Maptitude creates the bands and adds them to the map
along with a color theme to illustrate the driving
distances. Any portion of the map that is not
covered by a band is greater than the travel-time
you chose from the clicked locations.
-
To create a report with the map and
demographics, click
in
the Network Bands Toolbox. Maptitude generates the
report and displays it in a new window. The report
includes the demographic fields you specified for
aggregating.
You can customize a report with your company
name by choosing
Edit-Preferences and making changes on
the Reporting tab.
Reports can be printed, saved, exported, and
emailed.
To export your results you can
choose File-Export
Document from the Report
window menu to export your report for use outside
of Maptitude.
|