Maptitude Help / Creating Maps / Creating a Map / Mapping My Own Data
Mapping My Own Data
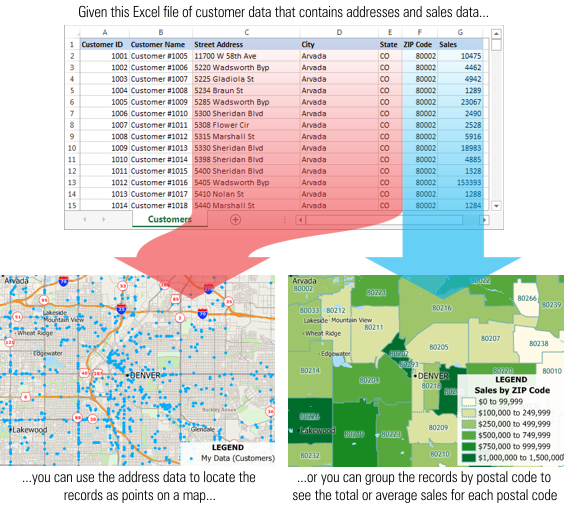
Create-a-Map Wizard can map your own data in two basic ways:
• Locate records in your file as points on a map
Create-a-Map Wizard has several locate options that will create a pin map showing the locations of your customers, stores, or other facilities. If your data include address information, and you want the maximum precision, you can locate your records to their precise street address. Otherwise you can pin map your data to a postal code or a city for slightly less precision. You can also locate your data by world city for locations not included in your country package.
• Show area boundaries with your data attached
Create-a-Map Wizard has several options for attaching your data to area layers. Use these options to create a color theme map showing the number of customers or total sales in each postal code, a color theme map of the number of hospital beds in each county, or a chart theme map showing your quarterly sales by state.
As you use Create-a-Map Wizard you will see a series of dialog boxes that will walk you through either process as described below.
 |
NOTE: Stages 1 and 2 of the Tutorial guide you through both of these options of mapping your own data. |
Locating Records in Your File as Points on a Map
 To Map My Own Data by Locating Points (Pin Mapping/Geocoding)
- Choose File>New Workspace or click
 on the Standard toolbar, choose New map of my data/table/spreadsheet, enter a name for the workspace, and click OK.
— OR —
If you already have a map open, choose Map>Add Table/Spreadsheet to a Map.
- Choose the file that contains your data and click Open. If you choose an Excel file, you will be prompted to choose a sheet to use.
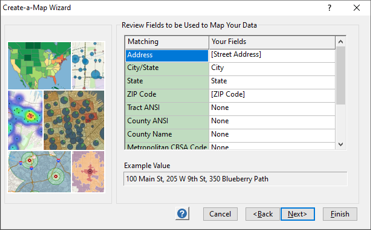
- Maptitude displays the fields it found in your data that can be used for mapping. If you see any errors, you can choose appropriate fields from drop-down lists in the Your Fields column. Otherwise click Next.
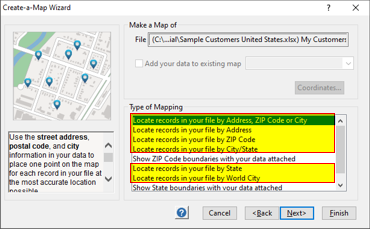
- In the Type of Mapping scroll list choose one of the options for locating records. The options will depend on the fields found in your data and the Country Package that you are using. For example, if you have address data and want the maximum precision, you would choose the Locate records in your file by Address option. If you need less precision, or are locating records with no address (e.g., P.O. boxes), you could choose the Locate records in your file by ZIP Code or Locate records in your file by City/State options.
Check Add your data to existing map if you want to locate your records on an open map in your workspace or leave it unchecked if you want to create a separate map.
 |
TIP: Choose the Locate records in your file by Address, ZIP Code or City option to have Maptitude try several options if your data contains a mixture of records with addresses and no addresses. |
- Click Next. Use the radio list to choose whether to import your data into the geocoded point layer or to link your data to the geocoded point layer.
| Option... | What it does... |
|---|---|
| Import data to map it | Maptitude imports the data to the map without maintaining any ties to your data source. If your source data changes, you will need to reimport it to see those changes on the map. You should choose this option if your data are relatively static or if you want to track changes over time. (e.g., You have an Excel file that contains location information on your stores. You can import the data because your store locations do not change frequently.) |
| Link data to map it | Maptitude associates the map with the data source and you can update your point layer with changes to your source data. You should choose this option if your data change frequently and you want a map that reflects the latest information. (e.g., You have an Excel file that contains location and weekly sales information on your stores. You may want to link the data if you open and close stores frequently or if you want to keep the map updated with the latest weekly sales information.) When you link your data, you MUST choose a column that contains unique IDs for each record in your data source. For more information on updating your linked point layers, see Updating Your Linked Data below. |
|
NOTE: By default, linked data will be read-only so you will not be able add fields nor will some Maptitude tools that require write access (such as Edit>Fill, Dataview>Table>Modify, and Tools>Analysis>Tag Points by Area) work. You can allow edits to a linked records dataview by choosing Edit>Preferences and checking the Linked Records box on the Editing tab. WARNING: If you allow edits, you should only edit data in fields that you add in Maptitude. Fields that come from the original data file will revert back to whatever is in the original source file when you update your linked data. |
- Click Next.
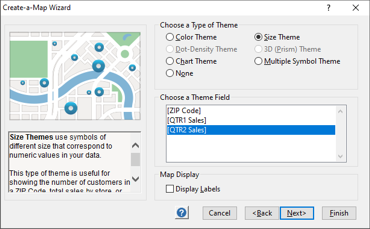
- Use the radio list to choose whether to display your data with a theme. Click None if you just want to create a point file of the features. Otherwise, choose a theme type and a data field to use. For more information on the types of themes see, Using Themes to Present Information.
If you want to label your data on the map, check Display Labels and choose a field (e.g., Name) from the drop-down list.
- Click Next. Use the radio list to choose whether to perform any analysis on your data. Click None if you do not want to perform any type of geographic analysis or make a choice from the radio list:
| If you choose... | Do this... |
|---|---|
| Buffers | • Click Fixed Sizes and enter up to three buffer sizes in the edit boxes or click Evenly Spaced and enter the sizes of the smallest and largest buffers and the distance between the buffers in the edit boxes. • Choose the map units for the buffer sizes. • Check the Separate Buffers box if you want to create separate buffers around each feature or leave unchecked to create merged buffers. If you want to identify the feature around which separate buffers are built, choose a field that contains the name; otherwise choose None. • Check the Cumulative Buffers box if you want to calculate cumulative demographics for each buffer or leave unchecked to calculate demographics for the individual buffers. • Check one or both output options if you also want to create a demographic report of the results. 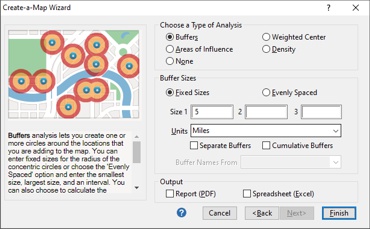 See Creating Buffers for more information. |
| Areas of Influence | • Check one or both output options if you also want to create a demographic report of the results.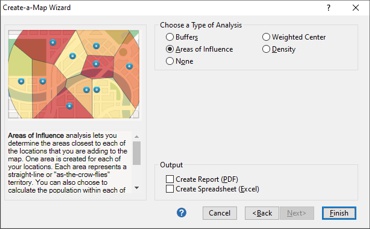 See Creating Areas of Influence for more information. |
| Density | • Choose a weighting field from the scroll list.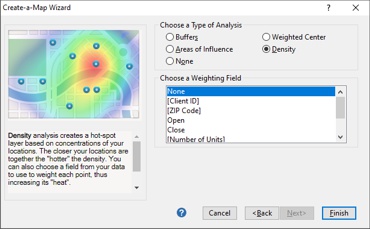 See Creating Density Grids/Heat Layers for more information. |
| Weighted Center | • Choose a weighting field from the scroll list.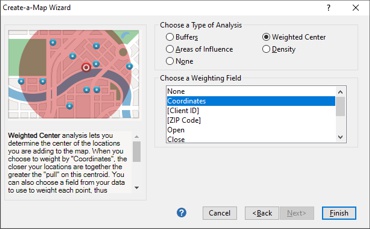 See Locating Weighted Centers and Service Areas for more information. |
- Click Finish.
- Create-a-Map Wizard looks over your data, locates the features on a map and displays a report with the Results. Click OK.
Maptitude displays a map with points for all of the features that it was able to locate on the map and displays them with any theme or label options you chose. In addition, if you chose any analysis options, the map will include those as well.
Showing Areas with Your Data Attached
To Map My Own Data by Grouping Records that are in Similar Areas (Thematic Mapping)
- Choose File>New Workspace or click on the Standard toolbar, choose New map of my data/table/spreadsheet, enter a name for the workspace, and click OK.
— OR —
If you already have a map open, choose Map>Add Table/Spreadsheet to a Map.
- Choose the file that contains your data and click Open. If you choose an Excel file, you will be prompted to choose a sheet to use.
- Maptitude displays the fields it found in your data that can be used for mapping. If you see any errors, you can choose appropriate fields from drop-down lists in the Your Fields column. Otherwise click Next.
- In the Type of Map scroll list choose one of the options for showing boundaries with your data attached. The options will depend on the fields found in your data and the Country Package that you are using. For example, to show your data aggregated by ZIP Code you would choose Show ZIP Code boundaries with your data attached or to show your data aggregated by state you would choose Show State boundaries with your data attached
Check Add your data to existing map if you want to locate your records on an open map in your workspace.
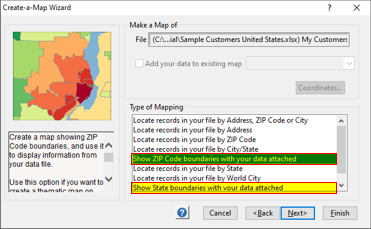
- Click Next. Use the radio list to choose whether to import your data to the area layer or to link your data to the area layer.
| Option... | What it does... |
|---|---|
| Import data to map it | Maptitude imports the data to the map without maintaining any ties to your data source. If your source data changes, you will need to reimport it to see those changes on the map. You should choose this option if your data are relatively static or if you want to track changes over time. |
| Link data to map it | Maptitude associates the map with the data source and you can update the data associated with the area layer with changes to your source data. You should choose this option if your data change frequently and you want a map that reflects the latest information. (e.g., You have an Excel file that contains weekly sales information on your stores. You may want to link the data if you want to keep the map updated with the latest weekly sales information.) For more information on updating your linked point layers, see Updating Your Linked Data below. |
- Click Next and use the radio list to choose whether to display your data with a theme. Click None if you just want to attach your data to a map without using a theme to illustrate values from your data. Otherwise, choose a theme type and the data field(s) to use. For more information on the types of themes see, Using Themes to Present Information.
If you want to label your data on the map, check Display Labels and choose a field from the drop-down list.
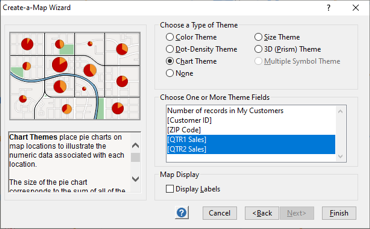
- Click Finish.
Maptitude joins your data to the area layer you chose in step 4, and if you chose a theme, displays a map illustrating the data you chose.
Updating Your Linked Data
If your source data change frequently you can update your map with the Map>Update Linked Records command. You can use the Map>Linked Records Settings command to see the file path of the linked file.
Updating Linked Point Layers
If you chose to locate records in your data as points on a map, Maptitude will do the following when you update the linked records:
- Geocode any new records in your source file and add them to the map
- Remove any features from the map for records that are no longer in the source file
- Update the values in all fields except the unique ID field
There are several changes that you cannot make to your source file:
- You cannot change the values in the ID field in your source file
- If the Allow Edits to a Linked Record user preference is not checked, you can rename or delete any column that is not the ID field or the field you used to locate the data. If the Allow Edits to a Linked Record user preference is checked, you cannot rename or delete columns. See Edit Preferences for more information.
Updating Linked Area Layers
If you chose to show area layers with your data attached, Maptitude will do the following when you update the linked records:
- Update the values in all fields
- Update any themes or labels in the map that use the attached data
You can rename or delete columns except for the one that is used to link the data (e.g., if you are linking to ZIP Codes, you cannot delete or rename the ZIP Code field).
|
NOTE: You must have located your data with the Link data to map it option chosen to update linked records. |
To Update Linked Data
- Choose Map>Update Linked Records.
Maptitude updates the point layer, adding and removing features and/or updating attribute data based on the current state of the source file.
To See the Location of the Source Linked File
- Choose Map>Linked Records Settings. Maptitude displays a dialog box containing the file path of the linked file, as well as the name of the layer/view and the linked field name.
- Click Close to close the dialog box.
To Replace a Linked File
- Choose Map>Linked Records Settings. Maptitude displays a dialog box containing the file path of the linked file, as well as the name of the layer/view and the linked field name.
-
Click ... in the right column to replace the linked file with another file.
-
Click Close to close the dialog box.
©2026 Caliper Corporation