Maptitude includes extensive geographic and demographic data so you can get started as soon as you start using the application. Compare this to most mapping and GIS software that require separate purchases or the paying for credits to access geospatial information. Maptitude is integrated with the best datasets to support successful mapping and problem solving. Surprisingly few map tools provide this data.
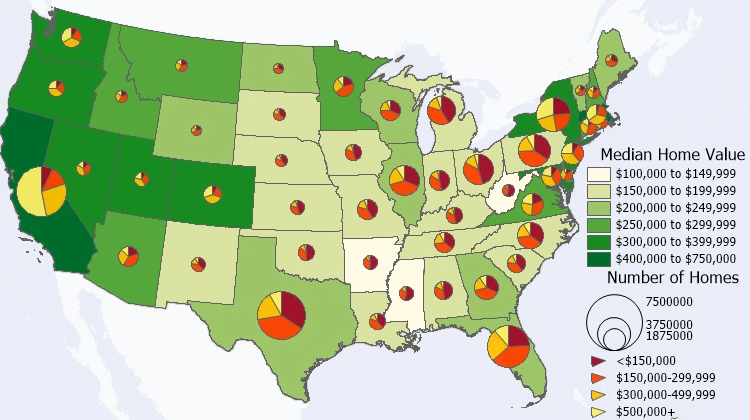
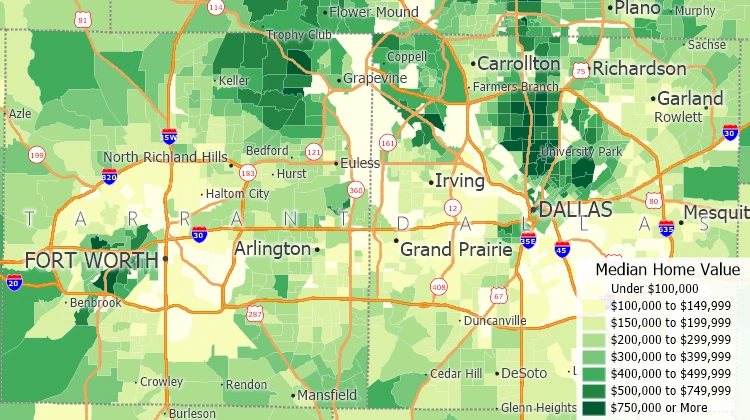
Maptitude includes nationwide geography at multiple levels of detail. With Maptitude and the United States Country Package you can make demographic maps at a national or neighborhood scale.
Maptitude includes one free detailed Country Package* of your choice. Each provides a wealth of data unavailable in competitor products. Up-to-date streets and addresses support accurate pin-mapping (geocoding) with travel times for computing routes and drive-time rings. Postal data and detailed demographics (where available) are included. Map Libraries allow you to easily create attractive geographic and demographic maps, with unlimited address locating and territory creation.
![]()
![]()
![]()
![]()
![]()
![]()
![]()
![]()
![]()
![]()
![]()
![]()
![]()
![]()
![]()
![]()
![]()
![]()
Also included are building footprints and comprehensive named landmarks that range from public facilities to commercial buildings including shops, restaurants, and retail stores.
Additional country packages can be purchased for US$695*. You can switch between countries, seamlessly refreshing Maptitude with country-specific tools. These include those for finding, pin mapping (geocoding), routing, and Create-a-Map Wizard mapping.
Please contact Sales to check on the availability of street, postal, demographic, and other data for countries not listed.

Includes demographics for U.S.A., Australia, Brazil, Canada, Mexico, New Zealand, and U.K.

Create maps at any scale, from nationwide to a neighborhood

Includes detailed area and point landmarks and building footprints where available
A global map is provided with Maptitude, allowing you to map your data anywhere on Earth by coordinate, manually, or by any populated place (village/town/city).
The Download Free Layers Add-In provides easy access to no-cost web-based data sources. This tool downloads administrative boundaries for any country (including China and the Middle East), while detailed data that includes many roads, postal codes, landmarks, natural features, and infrastructure is available for a growing number of countries.

Maptitude provides a comprehensive map data catalog. The available datasets are extensive and can be used for demographic analysis, sales and marketing analysis, and other types of business development research.

Business locations

Health data layers
A few political and Census boundary products require an additional fee. These include the small area Blocks that provide the most accurate counts of population at the local level. School and Legislative Districts are also provided separately. If you're creating targeted campaigns or planning a grassroots effort, these Maptitude political and Census boundaries can be an essential tool.
A complete list of available data products can be found on the Demographic and Geographic Data Products page.


* Currently available Country Packages:
2026 -
USA,
Australia,
Brazil,
Canada,
Mexico,
New Zealand,
United Kingdom
& Ireland; 2024 -
Europe,
United
Arab Emirates; 2020
-
Argentina,
Peru; 2017
-
Colombia;
2015
- Chile; 2014
-
Bolivia;
2013 -
Ecuador,
India,
South Africa.
Contact Caliper by email or +1 617-527-4700 for Europe Country Package
pricing.


Home | Products | Contact | Secure Store


