| Mapping, GIS, & Transportation Software Solutions |
| Mapping, GIS, & Transportation Software Solutions |
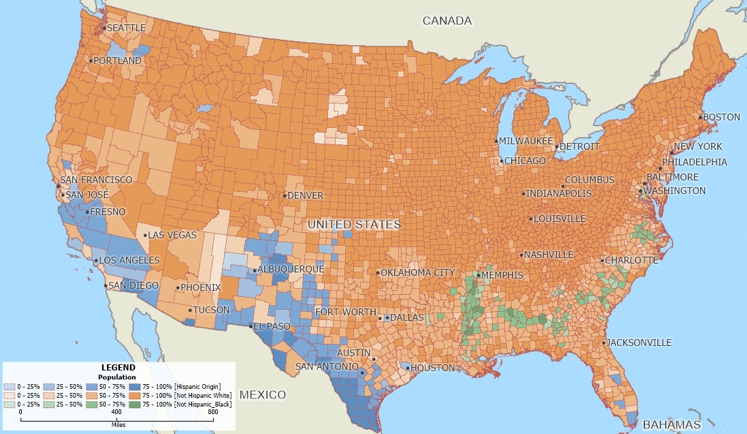
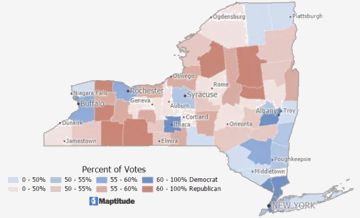
The Color Theme (Multiple Fields) add-in provides you with a new way to visualize and compare multiple fields of data. Also known as plurality maps, predominance maps, relationship maps, bivariate maps, or multivariate maps, multiple field themes can reveal patterns and let you see how items are connected. This is achieved using a method known as multivariate choropleth mapping, in which multiple color ramps merge to display all pattern combinations in a grid-like legend.
*NOTE: The Color Theme (Multiple Fields) add-in works only with latest version of Maptitude.
| To do this... | Do this... |
| Change the legend labels for a theme class | Edit the text in the Label column |
| Change the color of the theme class palette | Choose a color from the drop-down list in the Color column |
| Choose the total field to convert to percentages | Choose a field from the Denominator drop-down list (e.g., population, households) |
| Change the number of ranges | Choose from the # of Classes drop-down list |
| Modify the ranges for the classes | Enter different values in the Low % or High % columns |
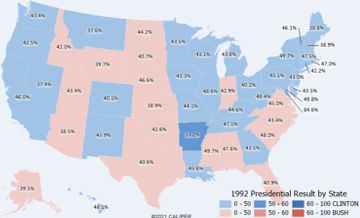
The Color Theme (Multiple Fields) add-in determines the percentages of each field that you use to determine which field is contains the plurality for an area. When comparing fields of populations or households the demoninator is straightforward. In other cases, you may need to create a formula field that contains the total value for the denominator. For example, you may have fields for counties that contain the Democrat, Republican, and Other votes from an election. To create a plurality theme map showing the party receiving the most votes in each county, you will first need to create a "Total Votes" formula field that is the sum of those three fields to use as the denominator.
You may want to adjust the values used in the ranges depending on the data that you are mapping. Suppose that you have fields with the number of McDonald's, Burger King, Wendy's, and Sonic stores in each state and a formula field that is the sum of the four stores:
If there is not much variation within the ranges for your theme, you may want to run the add-in several times adjusting the values in the ranges until you get a plurality map that is more meaningful.
Home | Products | Contact | Secure Store