|
December 2016 Newsletter |
|||
|
|||


Website | Contact Us | Pricing | Live Demo | Free Trial | Reviews
Sneak Preview of Maptitude 2017: Show Me Results Now!
Interface Redesign, One-Click Travel Time Reports, and Critical Data Update
Maptitude 2017 is due out in the first quarter of the new year, and we are offering you an exclusive first look at some of the new features!
Interface Redesign
The Maptitude team lives and breathes mapping and GIS. We need the
Maptitude interface to be as streamlined and efficient as possible.
We need Maptitude to easily and quickly generate results for
customers. We listen to and work closely with our community.
Based on our own experience and extensive user feedback we have created a new yet
familiar interface that meets the demands of a Maptitude analyst.
One-Click Travel Time Reports
We have responded to the growing demand for simple travel calculations and reports by introducing a new distance and
drive-time tool. The tool creates an Excel table that lists
the costs of travel between any number of origins and destinations.
In addition, the one-click Export to Excel tool now automatically includes travel time, and can be used with more map data. For example, you can filter on the ZIP Codes that you are interested in and then immediately create a demographic report.
Critical Data Update
Maptitude comes with the latest commercial grade map data and
demographic information available. Maptitude includes annually refreshed
Census and business data, and the most accurate USPS ZIP Code
boundaries. Maptitude doesn't skimp on
providing the best data: We don't substitute ZIP Codes for poor
alternatives such as ZIP Code Tabulation Areas (ZCTAs); We don't rely on open source map data or
inaccurate 3rd party address geocoders. We do include a massive
amount of data and industry leading technology that others can't compete with.
And all for only US$395 (per upgrade).
| Using Outdated Data & Technology? Upgrade to Maptitude 2017! | |
|
Featured Map
One Day Snow Fall Extremes by County
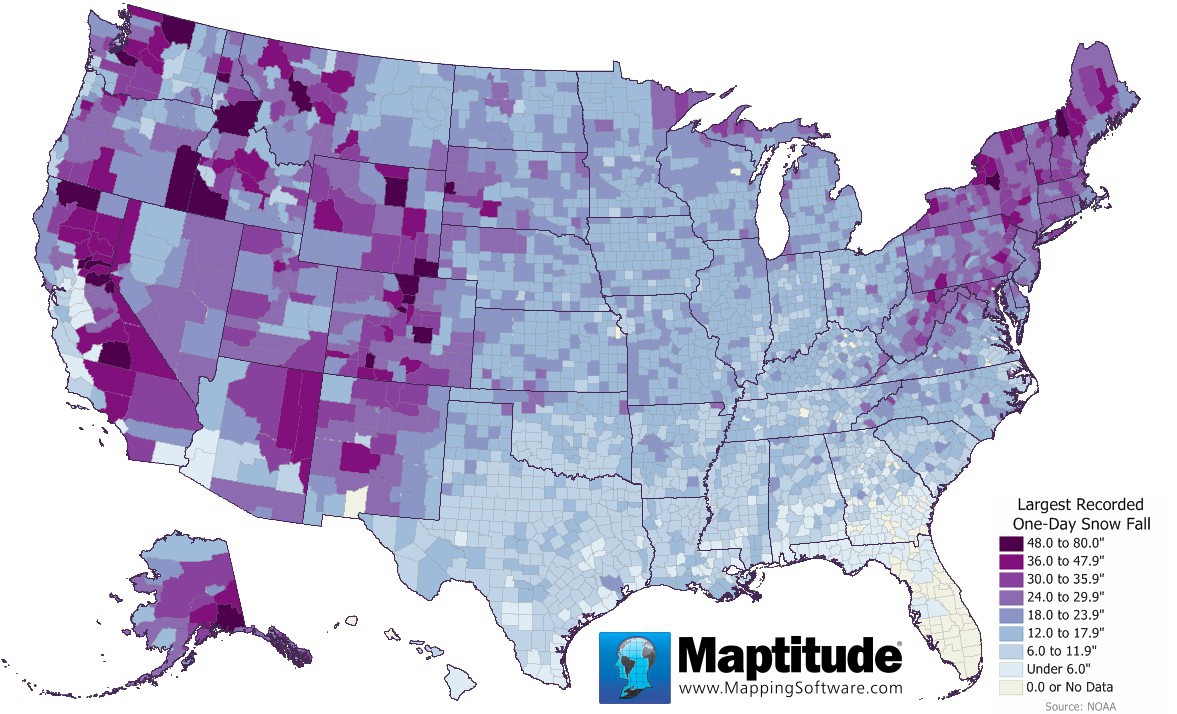
This month’s featured map shows the maximum 1-day snowfall extremes for each county in the United States (Source NOAA). Counties in each of the following states have reported 4 feet or more of snow in a single day: Alaska, California, Colorado, Idaho, Montana, New Hampshire, New York, Oregon, South Dakota, Washington, and Wyoming. And 43 of the 50 states have reported 2 or more feet of snow in a single day!
Tech Tip
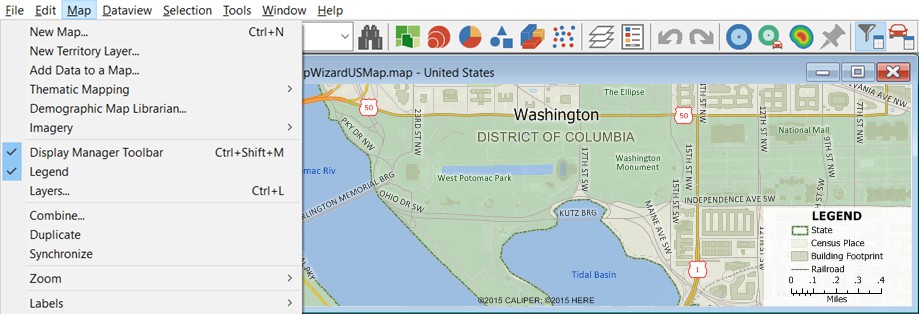
How do I locate data by coordinate?
|
|
To create the snow fall featured map, we accessed data from the National Centers for Environmental Information. The data included longitude and latitude fields and we used these columns to locate a point for every county. This Tech Tip shows how to map CSV coordinate data with Maptitude 2016. |
Tricks & Tips
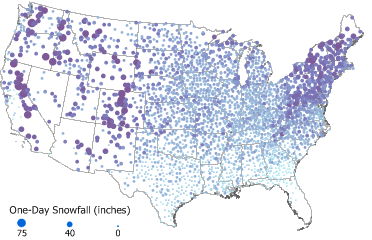
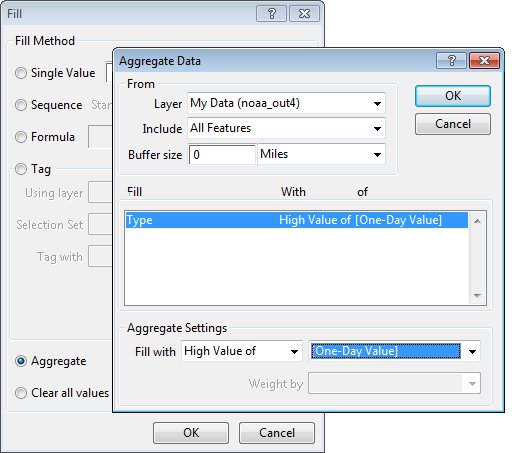
How do I transfer data from a point layer to an area layer?
|
|
To create the snow fall featured map, we took point data and associated it with county boundaries. First, in the Display Manager, we right clicked on the County layer and chose New Dataview. We then used Dataview-Modify Table to add one real type field for storing the highest one-day snowfall value from the point layer. We then highlighted the new field and right clicked to choose Fill.... By choosing the Aggregate option we were able to choose a point layer (e.g. as created in the Tech Tip), a fill method, and the field of data to use from the point layer. We were then able to thematically visualize the data via the Map-Color Theme command. |
Learning
Free MapPoint Webinar, Video, & Handout Now Available! September Training Dates!

|
|
MapPoint Webinar: This webinar will help MapPoint users new to Maptitude 2016. We will discuss mapping your data, changing the styles on a map, getting reports on custom-defined areas, creating drive time rings, the hover label tool and creating territories. There is also a free class handout here. February 2017 UK Training: Preliminary dates are February 21 and 22 (Bicester, UK). Express interest in these dates by emailing us here. April 2017 Training: Access experienced Maptitude trainers in a classroom setting. |