|
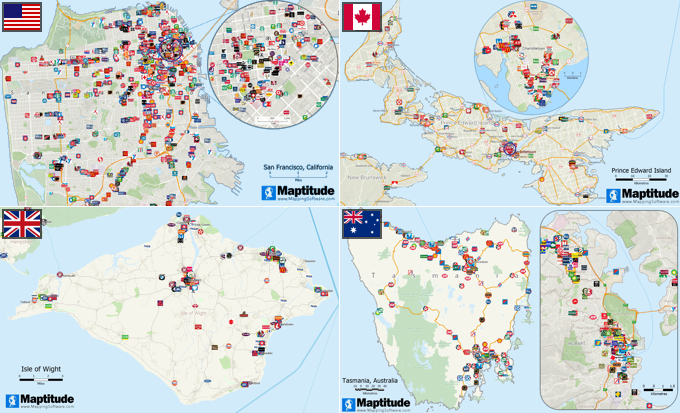
Maptitude 2025: More Powerful Routing & Logistics

What's the story?
This September, Maptitude 2025 delivers a major boost to your fleet and delivery workflows with enhancements to the routing, directions, and vehicle-management tools:
- Exclude specific link types (like ferries) or custom-defined road segments from routing calculations, offering precise control over route selection
- Plan routes with precision using per-mile or per-hour cost modeling – ideal for fuel, labor, or refrigerated ("reefer") operations
- Minimize vehicle idle time to cut labor costs and boost fleet utilization
- Export Excel route summaries and details, including stops, timestamps, distances, and cost breakdowns
- Analyze coverage using unlimited drive-time rings and multi-origin influence areas
Why is this important?
Streamlined routing transforms logistics into a strategic advantage. With Maptitude 2025, you can:
- Reduce operational costs by optimizing vehicle usage and minimizing idle time
- Generate rich, shareable route summaries for stakeholders or audit trails
- Evaluate territory or service coverage using advanced drive-time analytics
- Tailor routing behavior to avoid ferry crossings or roads with low clearance, ensuring routes align with fleet constraints and safety standards
Whether you're managing refrigerated delivery fleets, dispatching service vehicles, or planning logistics networks, Maptitude 2025 gives you the analytics and flexibility to keep your routes efficient, cost-effective, and fully transparent.
Read How
|
Maptitude Blog:
Translating Big Analysis into Big Understanding: Part Two
In the latest installment of our Business GIS for Everyone series, Dr. Murray Rice deepens the discussion on spatial segmentation, showing how you can elevate broad market analysis into targeted business strategy using your own customer data.
This post highlights the importance of blending a company's internal customer database, like purchase history and geolocated addresses, with demographic segmentation frameworks. The result? A rich, multi-layered view of where your product or service truly resonates.
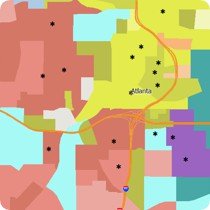
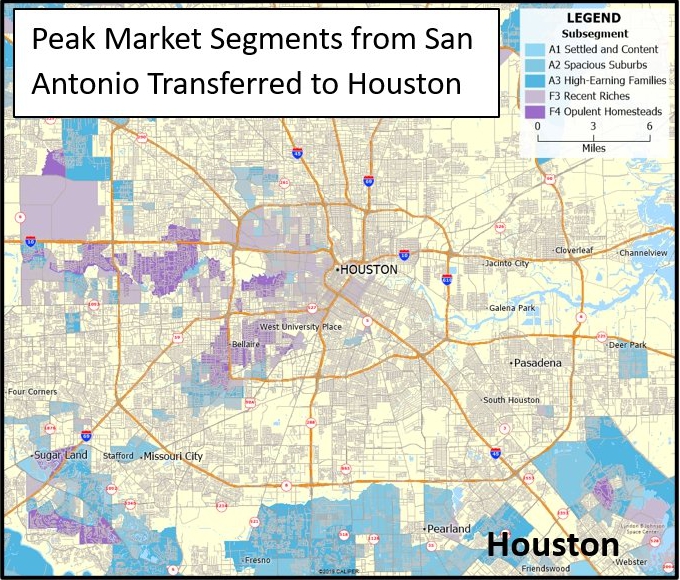
See how this method reveals zones of high market penetration, identifies the key segment types driving performance, and enables you to repeat success by locating similar segments in new markets. For example, insights from San Antonio segments can guide your expansion into Houston while also signaling areas that need validation, such as competition and real estate availability.
Discover how making your data spatially intelligent moves GIS from "nice tool" to strategic cornerstone.
» Explore Part 2 for actionable methods to turn complex data into competitive advantage |