For modern organizations, geography influences nearly
every business decision. Mapping analysis is the practice
of analyzing data through a geographic lens, by visualizing
information on maps to spot spatial patterns and relationships. This
approach reveals trends that might be hidden in spreadsheets or
charts alone. Maptitude mapping analysis software
provides all the tools, maps, and demographic data you need to
capitalize on these insights and understand how location impacts
your business. Every day, companies deal with databases full of
customer addresses, sales figures, facilities, and territories.
Maptitude helps uncover the trends hidden in this data,
allowing you to visualize patterns and make smarter,
location-based decisions.
With Maptitude, you can:
- Identify exactly where your customers are
(e.g. by address, city, ZIP Code, or neighborhood)
- Pinpoint areas with the highest sales and
revenues on a map
- Discover over- and under-served regions in
your market
- Detect geographic trends and opportunities
for expansion or investment
Additionally, the powerful
location intelligence tools
in Maptitude
give you a deeper understanding of the relationships in your data,
helping you optimize strategies, improve operational efficiency, and
drive business growth. These location-based analyses provide
critical insights for decision-making in sales, marketing, site
selection, logistics, and more.
Free Trial
Request a Demo
What is Mapping Analysis
Mapping analysis (a form of spatial data analysis) is the process
of examining location-linked information to identify patterns,
trends, and relationships across geographic areas. In mapping
analysis, data is plotted on maps, allowing analysts to see where
things happen, not just what happens. By visualizing data
geographically, organizations can observe distribution patterns
(such as customer clusters or sales hotspots) that inform better
decisions. For example, a mapping analysis technique is used to
identify spatial patterns in the phenomena being studied, whether
it’s consumer behavior, demographics, or any data tied to locations.
Mapping analysis is essential for location-based decision-making. It
helps businesses and policymakers answer questions like: Where are
our best customers located? Which regions are underperforming? What
areas are ideal for expansion? By combining your data with
geographic context, mapping analysis uncovers insights that
traditional data analysis might miss. Studies note that this
geographic perspective reveals patterns invisible in standard
spreadsheets, such as regional trends, proximity effects, or
clustering of events, providing a more complete picture. In fact,
understanding spatial relationships allows you to optimize
territories, identify market opportunities, and allocate resources
efficiently.
Whether you’re mapping sales by state or analyzing foot traffic
around store locations, mapping analysis adds crucial context that
drives more informed strategy.
Fundamentals of Mapping Analysis
At its core, mapping analysis involves linking data to specific
geographic locations and then using analytical techniques to derive
meaning from the spatial arrangement of that data. Key fundamentals
include:
- Data Geocoding and Layering: First, information (addresses,
coordinates, regions, etc.) is geocoded, meaning it’s assigned
real-world locations on a map. Multiple data layers (such as
customer locations, competitor locations, demographic maps) can then
be overlaid to see how different factors intersect geographically.
This layering allows analysts to examine relationships, for instance
correlating sales performance with demographic patterns on the map.
- Spatial Relationships and Measurements: Mapping analysis quantifies
relationships like distance, adjacency, and density. Techniques such
as buffering (drawing a radius around a point) or
proximity analysis
help measure distances and catchment areas, for example, finding how
many customers live within 5 miles of a store.
Overlay analysis is another fundamental tool, essentially “peering
through” stacked map layers to combine data, for instance,
overlaying a map of sales territories with census income data to
find high-income areas within each territory. These operations form
the building blocks of spatial analysis
and help answer complex location-based questions.
- Identifying
Patterns and Trends: A major goal of mapping analysis is to find
geographic patterns that inform decisions. This can include spotting
clusters (hotspots) of events, identifying regions that are
outperforming or under-served, and detecting correlations tied to
location. By representing data visually, mapping analysis makes such
patterns obvious, for example, a heat map might reveal that demand
is concentrated along certain highway corridors, or a thematic map
might show higher revenue in densely populated counties.
- Outputs,
Maps, Charts, and Reports: The results of a mapping analysis are
often presented as thematic maps, tables, or charts that communicate
insights clearly. Modern GIS (Geographic Information System) tools
have analysis modules and output capabilities to produce maps and
reports that answer specific geographic queries.
For instance, a GIS can output a color-coded map showing sales by
region alongside a table summarizing those sales, or generate a
report listing the top ZIP Codes by number of customers. These
visual and tabular outputs help decision-makers quickly grasp the
spatial trends. Mapping analysis software essentially turns raw
location data into actionable intelligence, producing maps, tables,
and answers to location-based questions that organizations can use
to strategize.
Importantly, mapping analysis is widely used across industries.
Geographic Information Systems are routinely employed by marketing
analysts, retail site selection specialists, urban planners,
logistics managers, and other professionals whose work relies on
spatial insight.
In the United States, for example, companies use mapping analysis to
find the best markets for expansion, governments use it to plan
infrastructure and emergency response, and researchers use it to
study patterns like disease outbreaks or social trends, all
leveraging the same fundamentals of spatial data analysis.
Free Trial
Request a Demo
Map Analysis Features
Maptitude offers a wide range of
map analysis features designed to be powerful yet accessible.
The software combines robust GIS capabilities with an intuitive
interface, making advanced spatial analysis achievable for users at
any skill level. Here are some of the key mapping analysis features
provided by Maptitude:
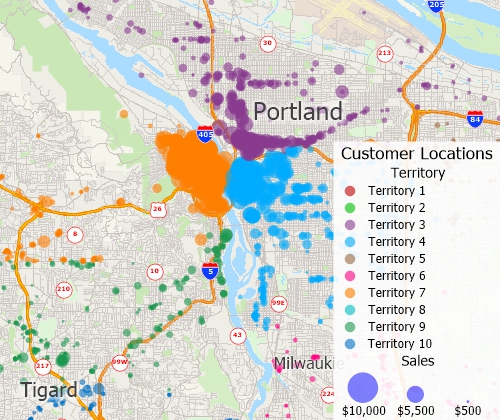
- Thematic Mapping & Visualization: Easily
create thematic maps (such as color-shaded heat maps, choropleth
maps, and proportional symbol maps) to visualize your data.
Maptitude lets you customize every aspect of your maps, from colors
and symbols to adding charts or even 3D graphics, so you can
highlight patterns in sales, customers, demographics, and more.
For example, you might generate a U.S. map color-coded by sales
revenue per capita, or add pie chart symbols on a map to show market
share by state. These visualizations help turn complex data into
immediately understandable geographic insights.
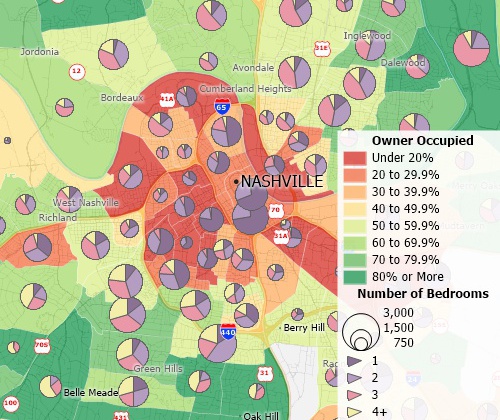
Create many types of thematic maps.
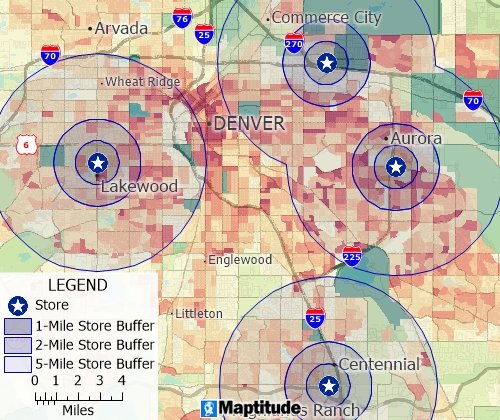
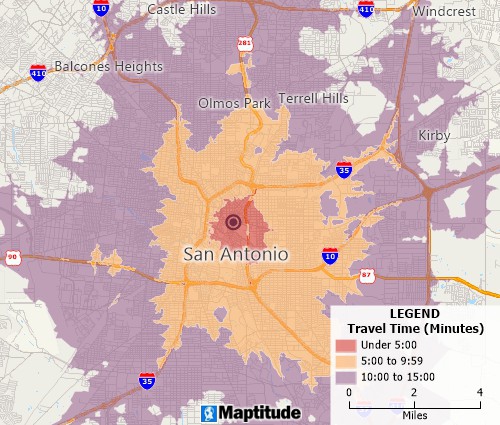
- Spatial Analysis &
Query Tools: Maptitude includes an array of GIS analysis tools to
explore spatial relationships in your data. You can perform
drive-time and distance ring analyses (e.g. draw 10-minute
drive-time areas around your stores to see coverage),
create buffers around locations at any radius, and combine multiple
layers to find overlap or proximity. The software can overlay
datasets, for instance, layering customer points over a demographic
map to find high-opportunity areas, and run queries to filter data
by location (find all customers within X miles of a branch, etc.).
These tools allow you to identify clusters, gaps, and relationships;
for example, Maptitude can automatically highlight “hot spots” or
concentrations of data points and flag regions that are under-served
by your business.
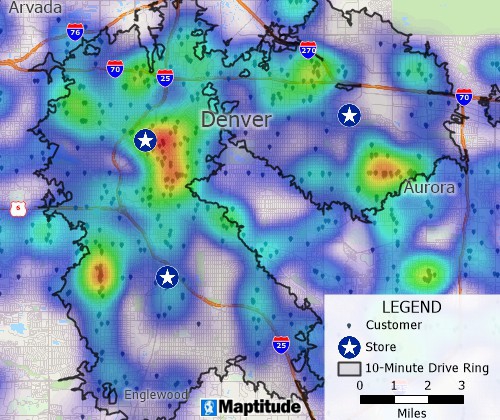
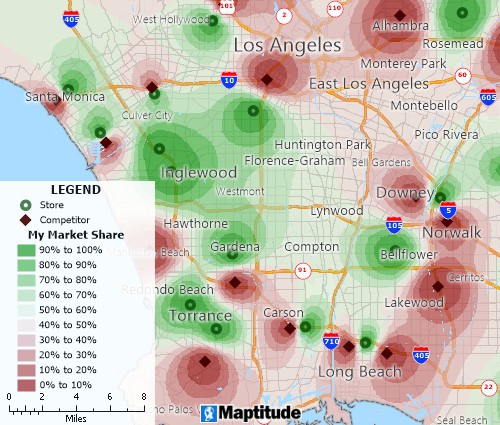
A heat map indicates where there are
heavy concentrations of customers and a 10-minute
drive-time ring shows which customers and clusters are
located near existing stores.
- Territory and Market Area Tools: If you need to define sales
territories or trade areas, Maptitude has you covered. The software
lets you build custom territories by grouping geographic areas (such
as ZIP Codes, counties, or states) based on criteria you choose.
You can balance territories automatically (ensuring each has roughly
equal population or sales potential) and even handle hierarchical
territories (e.g. districts composed of multiple territories).
Maptitude also supports market area analysis, for example, drawing
drive-time regions or circles around a location to delineate its
trade area, and then analyzing the demographics or customers within
each area. This helps you discover which locations have the highest
potential or which regions are overlapping. Additionally, site
location optimization tools are included: you can evaluate and
compare sites by relevant metrics (population within 10 miles,
nearest competitor distance, etc.), helping you choose optimal new
store or facility locations.
Combined with the routing features for logistics (finding shortest
paths, planning efficient delivery routes, etc.), these tools ensure
you can perform end-to-end spatial analysis for business planning in
the U.S. or any region.
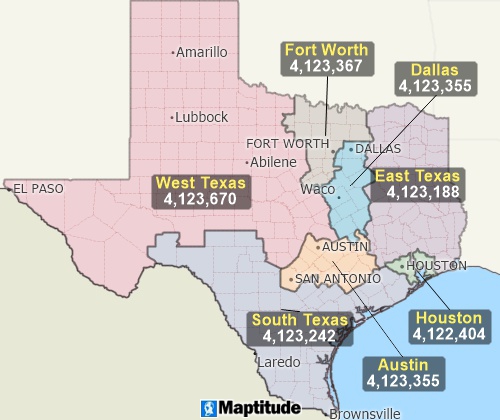
Create territories from ZIP Codes, tracts, counties, or streets
- Data Integration & Geocoding: Maptitude
makes it simple to bring in your own data and map it. You can import
data from Excel spreadsheets, Access databases, SQL Server, Oracle,
and many other sources, Maptitude supports 70+ geospatial and data
formats including Shapefiles, KML, GeoJSON, and more.
This means you can take virtually any dataset (customer lists, sales
by region, etc.) and easily plot it on the map. The software also
provides unlimited geocoding, which automatically converts addresses
or place names into map points.
For example, you could geocode thousands of customer addresses to
see their distribution on a map. With two-way data sync and ODBC
database connectivity, Maptitude ensures that integrating geographic
analysis into your existing business data workflows is
straightforward.
There are no technical barriers, even large datasets can be mapped
and analyzed with ease, so you can enrich your data with location
context.
Batch geocoded an unlimited number of records and show your data on a map
- Built-in U.S. Maps & Demographic Data: One standout feature
of Maptitude is that it comes pre-loaded with extensive geographic
data, especially for the United States.
Right out of the box, you have detailed U.S. street maps (with
address data for geocoding and travel times), administrative
boundaries (down to ZIP Codes, counties, etc.), and a wealth of
up-to-date demographic data (population, income, age distributions,
and more). Also included are thousands of named landmarks and
business locations across the country.
This means you don’t need to buy or find separate datasets,
Maptitude provides a complete USA data package for analysis.
For example, you can instantly map U.S. Census statistics to
identify high-income areas, or use included business counts to find
regions with few competitors. All the data is ready for immediate
use, allowing you to focus on extracting insights rather than
sourcing data.
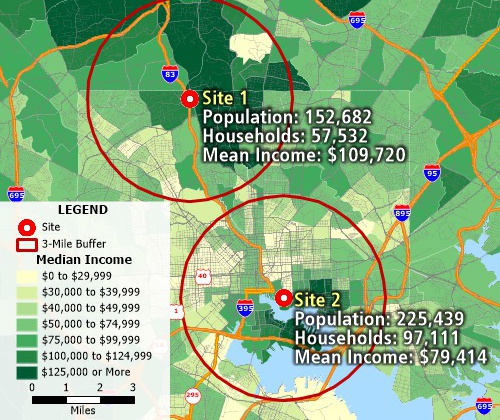
Use Maptitude mapping software's
built-in data to analyze and compare sites. This map
compares the population, number of households, and mean
income of the population within 3 miles of two different
locations.
Free Trial
Request a Demo
Why Choose Maptitude for Mapping Analysis
When it comes to mapping analysis software, Maptitude stands out
as a top choice for U.S. businesses. Here are a few compelling
reasons why Maptitude is trusted for spatial decision-support:
- Comprehensive Data Included: Maptitude
provides an unmatched wealth of built-in data for the United
States, so you can start your analysis immediately. It includes
nationwide streets, highways, ZIP Code boundaries, landmarks,
and detailed demographic datasets without
additional cost.
Postal data and recent U.S. Census demographics are
already integrated.
This saves you time and money, letting you focus on insights
rather than hunting for data. Whether you need to map population
density in New York or median income in California, the
Maptitude ready-to-use data has you covered.

|
“I loved the integrated country data package so I didn't have to download census layers and other info - it was all built in.”
Alex Martin
Sr. Program Manager, Amazon |
- Intuitive for All Users: You don’t need to
be a GIS expert to use Maptitude. The software is designed with
wizard-driven tools and an Office-like interface
that make it easy to learn and use.
For example, common tasks (like geocoding a list of addresses or
creating a thematic map) are guided by step-by-step wizards.
Maptitude uses a familiar “single document” model for maps
(similar to Microsoft Office apps), so actions like saving
projects or layering data feel straightforward.
It’s built for users of all skill levels, from
beginners to mapping professionals.
This means a marketing manager or sales VP can quickly create
insightful maps without a steep learning curve, while power
users can still access advanced features. The
user-friendly design helps teams adopt the tool quickly
and get value from mapping analysis right away.

|
“Maptitude is
incredibly user-friendly. It can be very intimidating to use a new geospatial tool without formal training. With Maptitude, I started with no training and quickly became the in-house expert at my company. We are locating new stores, optimizing existing footprints and quantifying local market opportunities. I learn something new every time I open Maptitude and it certainly has
become the go-to tool for our geospatial analytics.”
John Cochran
Strategic Analyst, PPG Industries |
- Flexible & Cost-Effective: Unlike many GIS
solutions that lock you into expensive subscriptions, Maptitude
offers flexible licensing and deployment. You can choose a
one-time purchase for a completely offline desktop
solution, or opt for a cloud subscription if you prefer.
Crucially, Maptitude can run fully offline and requires
no ongoing fees, you own the software and your data,
which is great for security and budget predictability.
This flexibility, combined with the rich feature set, makes
Maptitude extremely cost-effective. You’re getting
enterprise-level mapping capabilities without the high
price tag of competitors (and without needing to pay
for add-ons like data, since it’s included). For organizations
in the U.S. that deal with sensitive data or remote locations,
the ability to work offline is a major advantage. Overall,
Maptitude delivers huge value by providing
all-in-one mapping analysis functionality at a fraction of the
cost of other platforms.

|
“Amazing product at a great value with even better customer service! The benefits have been
providing invaluable insight to upper management regarding what kinds of opportunities are out there and consequently, giving the company a chance
to grow via acquisitions. Moreover, the additional features within Maptitude allow you to identify new areas of growth or new markets
to enter given the plethora of demographic data it has embedded within the software.”
Raymond Kwock
Senior Financial Analyst, AutoNation |
- Trusted by Industry Professionals:
Maptitude isn’t a newcomer, it’s a proven solution used by
businesses across various industries for many years. Thousands
of professionals in sectors like retail, franchising, banking,
real estate, and logistics rely on Maptitude to make
location-smart decisions. When
you choose Maptitude, you’re adopting a solution that has been
battle-tested by countless organizations, including Fortune 500
firms, to drive growth and efficiency through mapping analysis.

|
“I've been using Maptitude for
more than 15 years. It is simply the best tool
available for businesses that need a market planning
mapping and data resource. It can do everything I need
it to do - from the very simple to the complex. It
integrates nicely with other programs and file types
making analysis and presentation very easy. I highly
recommend Maptitude to firms who need a function-rich
GIS mapping solution. It is the best!”
Mike Sawyer
Market Planning, Qdoba Mexican Eats
|
- All-in-One, Powerful Solution: With
Maptitude, you get the full spectrum of GIS mapping and analysis
features in one platform. There’s no need to patch together
multiple tools or purchase extra modules, everything from simple
pin mapping to advanced predictive modeling is supported. The
software’s engine is built by Caliper Corporation (with decades
of GIS experience), so it can handle large datasets and complex
computations quickly. Whether you want to conduct a detailed
market analysis for the U.S. market or perform network routing
for a fleet of vehicles, Maptitude has the tools built-in. Users
consistently mention how feature-rich the software is, yet it
remains stable and easy to use.
This balance of power and simplicity means you won’t outgrow the
software; as your mapping analysis needs become more
sophisticated, Maptitude will support you with advanced
analytics (such as spatial statistics, territory optimizations,
site modeling, etc.) all within the same intuitive interface.

|
“Maptitude is user-friendly and
provides all the tools necessary to produce effective maps and data analysis. Caliper's sales and technical support teams are knowledeable and responsive.”
Robin Merrill
GIS Specialist, Lapkoff & Gobalet Demographic Research
|
In summary, Maptitude is a mapping analysis solution that
combines extensive data, ease of use, and advanced analytical power
at an attractive value. For U.S.-based businesses especially, the
inclusion of up-to-date American geographic and demographic data is
a game-changer, enabling immediate insights into markets and
operations. These advantages make Maptitude a leading choice for
anyone looking to leverage mapping analysis to make smarter
decisions.
Free Trial
Request a Demo
Try Maptitude Today
Ready to unlock the insights hidden in your location data?
Try
Maptitude for yourself and see how mapping analysis can transform
your decision-making. Maptitude offers a free trial and live demo
options, giving you hands-on experience with its features on your
own business data. With just a few clicks, you’ll be visualizing
customers on a map, analyzing sales territories, and discovering
patterns that can drive your next strategy.
Don’t miss out on the
power of location intelligence. Try Maptitude today and equip your
team with the best mapping analysis software for smarter growth.
Experience how easy it is to turn raw data into interactive maps and
actionable insights. Start your free trial or request a demo now to
see the difference Maptitude can make for your organization’s
success!
Free Trial
Request a Demo
 Check out our G2 Reviews