Control every visual element on every layer. Set marker color, icon, size, line style, and area fill to match your message and brand.
Per-layer stylingBrandable

Turn layers, labels, and themes on or off from one panel. Reorder and group layers to keep complex maps readable.
Layer controlGrouping

Examine your data at national, state, city, or neighborhood scale, and set the scales where each layer, label, or theme appears.
National to neighborhoodScale ranges

Label features with any field, font, or style. Control placement, halos, and conflict rules for clean, readable maps.
Any fieldConflict rules

Add a dynamic legend that updates with your themes. Style it to match the map and export it for reports.
DynamicExportable

Add titles, callouts, north arrows, logos, and freehand shapes. Annotate maps for handouts and presentations.
AnnotationsNorth arrow

Add aerial, satellite, and WMS imagery for context and editing. Trace and digitize features over real-world backgrounds.
Satellite & WMSReference layer

Pin scanned maps and photos to real coordinates. Organize many images into a library you can map at once.
GeoreferenceImage library

Hide everything outside your study area. A mask keeps the focus on the region that matters.
Study areaClean focus

Shade areas, lines, or points by any field. Choose graduated, category, or pattern themes with automatic legends.
ChoroplethCategories

Show counts as scattered dots so density reads at a glance. Set how many records each dot represents.
Density viewPer-dot value

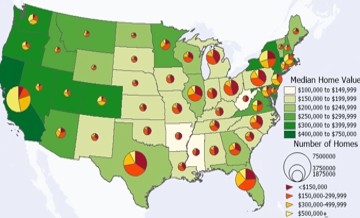
Place a pie or bar chart at each location to compare categories.
Per-location charts

Scale marker size by any value, such as revenue or headcount, to make proportional-symbol and bubble maps. Compare magnitude across all locations at once.
Proportional / bubbleMagnitude

Raise areas into 3D prisms by value for a striking view of differences. Great for income, sales, and population maps.
Rare3D extrusionHigh impact

Split data into classes by quantile, equal interval, natural breaks, standard deviation, nested means, and more.
RareNatural breaks9+ methods

Save a theme and reuse it on the next map or dataset. Keep a consistent style across every report.
ReusableConsistent style

Build box plots, histograms, scatter, and radar charts from your data. New log-scale histograms handle skewed values like income.
New in 2026Box / histogramLog scale

Work with the full data table beside the map. Sort, filter, and edit records and watch the map update with them.
Live tableMap sync

Click a feature to read its full record. Switch layers at the same spot, or hover for a quick tip.
Click to readMulti-layer

Summarize a field by counts and totals. Join, aggregate, and tidy tables without leaving Maptitude.
Counts & totalsJoin / aggregate

Add calculated fields with built-in functions. Compute rates, ratios, and scores right in the data table.
Calculated fieldsFunctions

Map layers straight from spatial databases, Microsoft SQL Server Spatial, PostgreSQL with PostGIS, and Oracle Spatial, plus any ODBC source. Refresh the map as the source data changes.
SQL Server / PostGIS / OracleODBCLive link

Every license includes a Country Package with street maps, postal boundaries, business and reference layers, and demographics. The USA package, for example, adds thousands of Census and ACS variables down to the Block Group level, plus population projections, healthcare, GDP, and ZIP business data. International packages cover most of the world.
Street maps & boundariesUSA Census & ACSInternational packages

Read and write Shapefile, GeoJSON, KML/KMZ, GeoPackage, File Geodatabase, MapInfo TAB, AutoCAD DWG/DXF, Excel, CSV, dBase, PostGIS, and Oracle Spatial, all locally, with no converters needed.
RareRead & write50+ file typesGIS / CAD / image / table

Maptitude picks a sensible map projection for you and updates it as you change the map's scale or center, with no coordinate-system setup. You can always see the current projection, turn it off, or choose your own.
RareAutomaticOverride anytime
Work in hundreds of coordinate systems and projections. Mix layers from different systems on one map.
Hundreds of systemsOn-the-fly

Convert between coordinate systems, datums, and ellipsoids with control over the math. Handle precise survey and engineering data.
RareDatums & ellipsoidsPrecise
Stretch and align a layer to known control points. Fit older or rough data to an accurate base map.
RareAlign layersControl points
Build topological or non-topological point, line, and area layers. Conflate, clip, dissolve, merge, intersect, union, simplify, and convert between points, lines, and areas.
Full editingConflate / simplify

Active Topology keeps connected features correct as you edit. Move a shared intersection and the streets that meet there move with it; reshape a shared boundary and the neighboring areas stay aligned. It helps prevent gaps, overlaps, slivers, dangling lines, and open polygons.
RareMaintains relationshipsPrevents gaps & slivers

Edit with snapping so new features connect cleanly to existing ones. Step back and forward through your edits with full undo and redo.
SnappingFull undo / redo

Run buffer, overlay, dissolve, merge, and conversion steps as a workflow. Prepare and reshape data for analysis.
RareWorkflow stepsReshape data

Let several people edit the same geographic files safely. Locks and check-in keep edits from colliding.
RareConcurrent editsSafe locks

Document the source, date, and meaning of each layer. Keep projects clear and audit-ready.
Documented layersAudit-ready
Save a whole project, maps, tables, layouts, and settings, as one workspace. Autosave protects your work.
Full projectAutosave

Save views as bookmarks and jump back instantly. Keep an overview window and sync scales across maps.
Saved viewsOverview window

Compose maps, legends, tables, and charts into a layout. Print to handouts or poster-size sheets.
Poster sizeMulti-element
Generate one map sheet per area automatically, such as a page for every region. Save hours on repeat reports.
RareOne page per areaBatch
Export maps as images, web pages, or animated GIFs. Share results anywhere without special software.
Image / HTMLAnimated GIF

Create demographic, routing, and territory reports in Excel or PDF. Use custom layouts and automatic area summaries.
Excel / PDFAuto summaries

Publish a desktop map to Maptitude Online and share it by a stable link. Keep your analysis on the desktop and share the result.
Stable linkDesktop + online

Attach files, documents, and web links to map features. Open supporting material straight from the map.
Feature linksAttachments

Every copy includes the GISDK developer kit. Write add-ins and full custom applications in the built-in Caliper Script language, with a script toolbar and debugger and 850+ documented functions.
RareIncluded dev kit850+ functionsBuilt-in debugger
Drive Maptitude from your own software. Call it from .NET or as a COM object, or automate it from Python, C#, and other languages.
Python / C# / .NETCOM object
Maptitude includes a professional relational database. A single table holds up to 2.14 billion records and 32,767 fields, with unlimited field width, so big datasets stay fast and local.
Rare2.14 billion records32,767 fields
Estimate regression and binary logit models on any map layer or table. Build and score predictive models without leaving the map.
RareRegressionBinary logit
Color adjacent areas so no two neighbors share a color, using the Dsatur algorithm. Get clean, readable area maps automatically.
RareDsatur algorithmAuto colors
Adjust contrast, smooth, and resample image layers with bilinear or bicubic interpolation. Get clean aerial and scanned backgrounds.
Contrast & smoothingBicubic
Open, duplicate, tile, cascade, and synchronize many maps at once. Compare scenarios side by side.
Tile & cascadeSynchronized

Geocode against your own reference data by building custom indexes. Match records to internal IDs, assets, or boundaries.
RareCustom indexYour reference data

Turn a spreadsheet or address list into a finished map with a guided wizard. Pick a template, your data, and a theme, and you have a map in minutes.
Guided wizardTemplates

Open a library of ready-made, pre-styled maps, and save your own as reusable templates. Start every project from a polished base.
Pre-styled mapsReusable templates

Connect a GPS receiver to track location in real time, and import or export GPX. Animate playback, build layers from tracks, and place geotagged photos.
RareReal-time trackingGPX import / export

Record map interactions, animations, and fly-throughs as video. Share dynamic results in presentations without extra software.
Screen recordingAnimations

The full help system, tutorials, and reference install locally, so air-gapped and field users keep complete documentation with no internet connection. The same Help is also available online when you want it.
Installed locallyAir-gap readyOnline too