Maptitude mapping software features powerful mapping and location intelligence tools giving you a deeper understanding of the geographic relationships in your data.
One of the best reasons to use Maptitude is to unearth and analyze the geographic components of your data. Maptitude includes many map analysis tools that allow you to understand trends, evaluate sites, reduce costs, and define optimal routes. You will be amazed at how quickly you can enhance your decision making using this easy-to-use mapping tool.
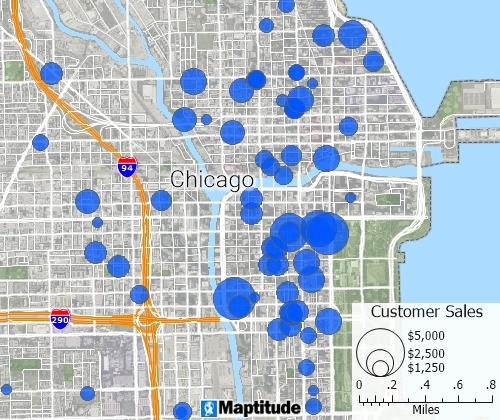
Create pin maps by batch geocoding an unlimited number of records by address, postal code, coordinate, and more for unlimited numbers of records
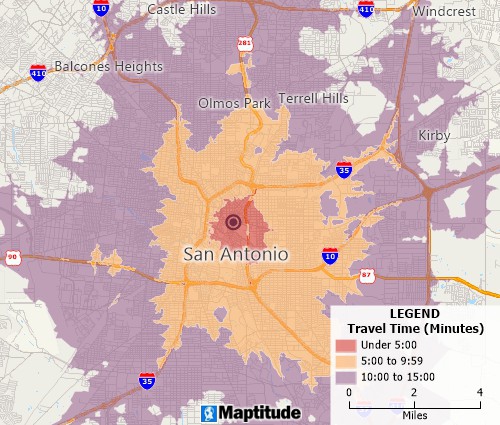
Determine drive-time radius or distance rings at any interval and create reports of the results
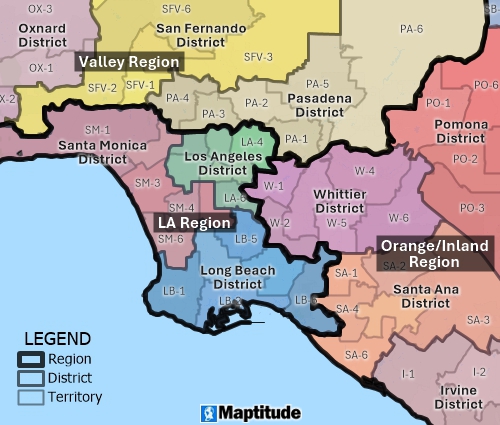
Build custom hierarchical territories from a table or by interactively clicking on a map
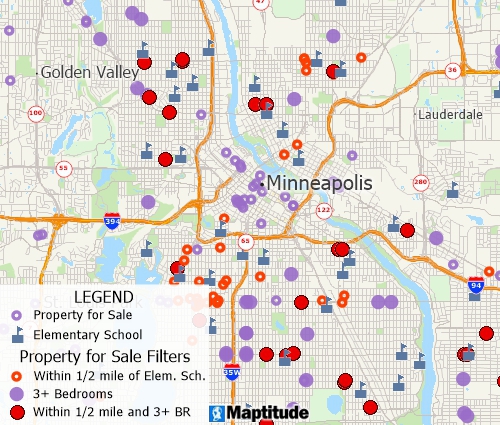
Perform spatial queries by filtering features based on location, proximity to other features, by radius, by pointing, by polygon, based on a value or condition, or based on level of adjacency,
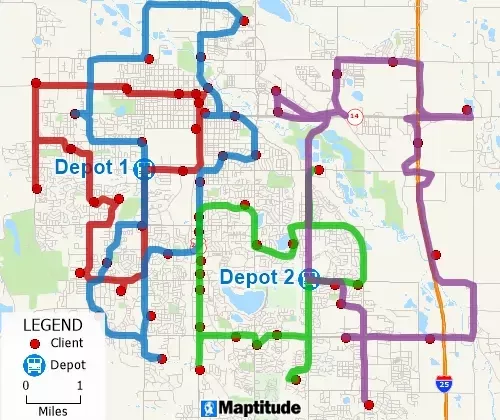
Optimize routes for several vehicles needing to reach many destinations for deliveries and pickups in fixed time windows and create itinerary reports
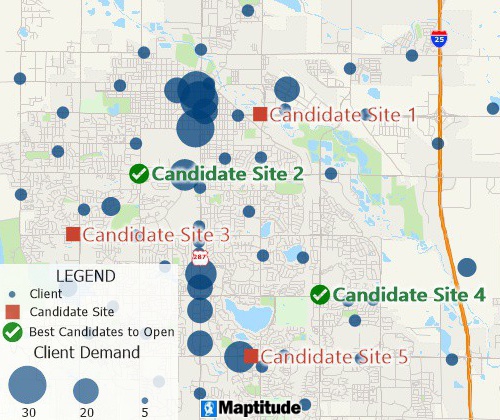
Facility location mapping tools can find suitable locations for expanding your business from a set of candidate sites
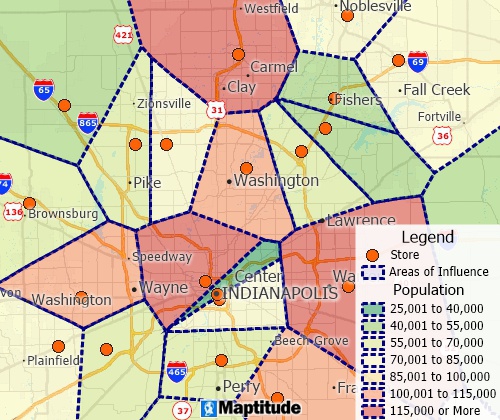
Thiessen polygon/Voronoi diagram map tools can create straight-line distance territories
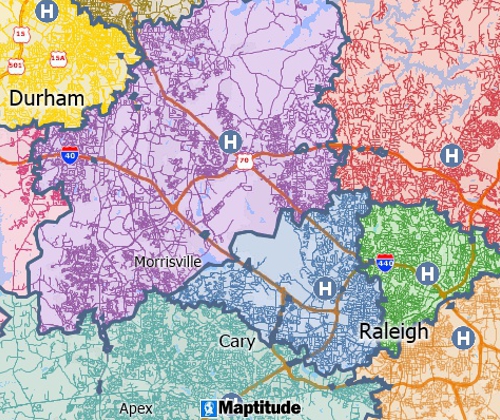
Drive time radius maps show the catchment areas of facilities based on driving time or distance
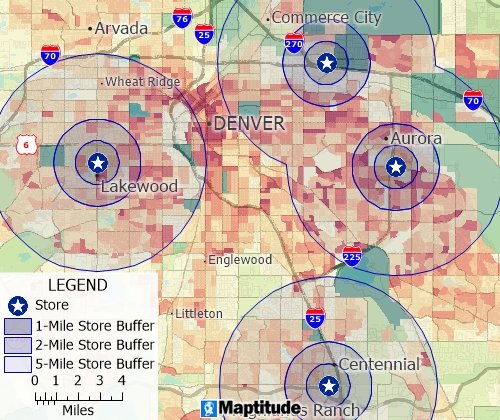
Create joined or separate cirular buffers around map features to analyze proximity
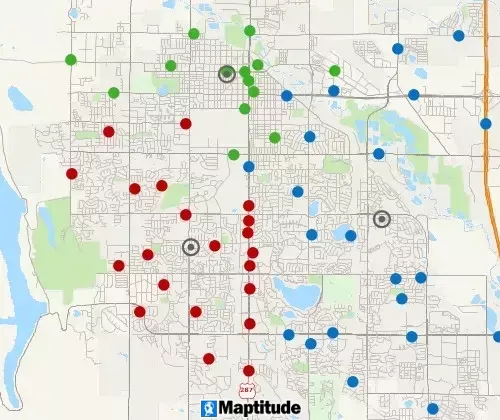
A clustering tool groups points or areas into compact clusters, while placing optional constraints on the clusters such as maximum size or a balanced total field, such as sales or population
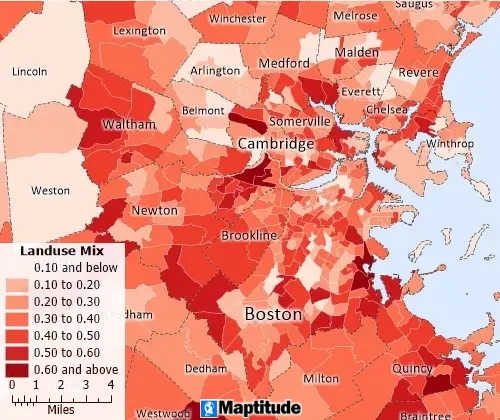
Quantify access to different land use types to measure the evenness of distribution of land-uses present in a region
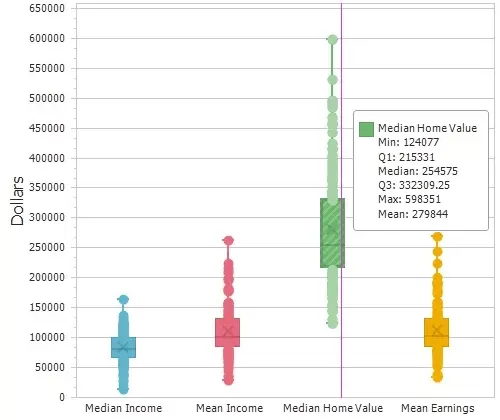
Compute summary statistics (sum, min, max, mean, standard deviation), compute spatial autocorrelation, and create box plots, histograms, and radar charts
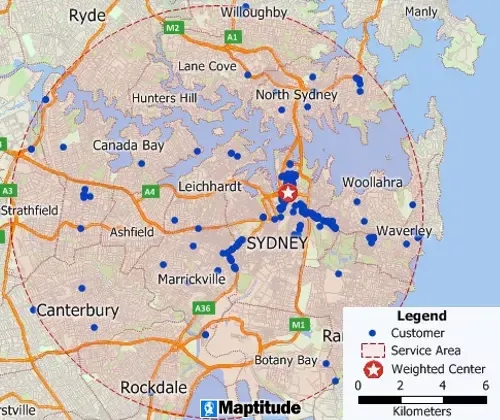
Weighted center calculations allow the identification of centers of "gravity" among points
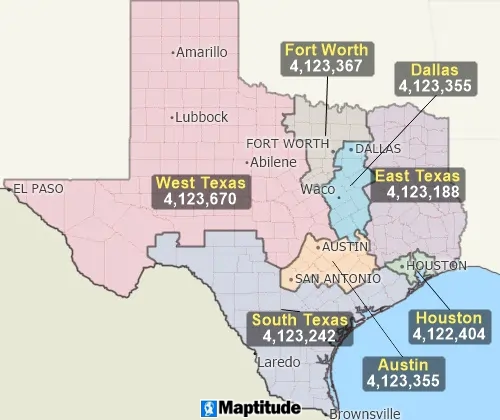
A balancing tool automatically creates territories that are balanced by a specific demographic variable
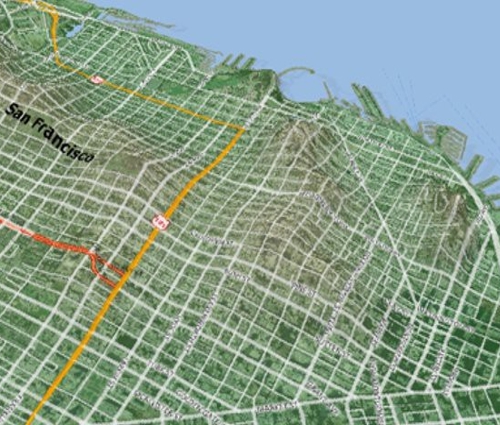
Analyze and display surfaces on a two-dimensional map or as a 3D map and export as Digital Elevation Models (DEMs) or Triangulated Irregular Networks (TINs). Create surface profile charts and contour maps, and determine terrain shortest paths, viewsheds, and lines of sight. You can also build detailed 3D models and record fly throughs.
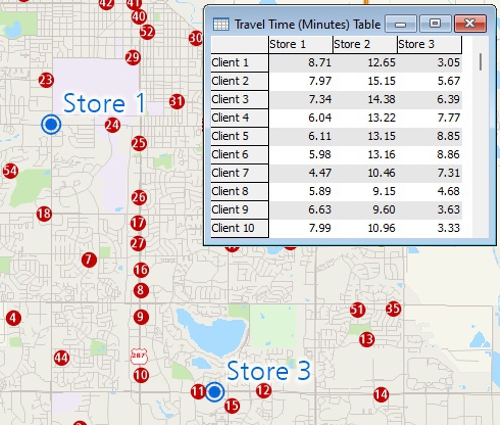
Measure areas and distances, find closest features, and compute drive-time or distance tables
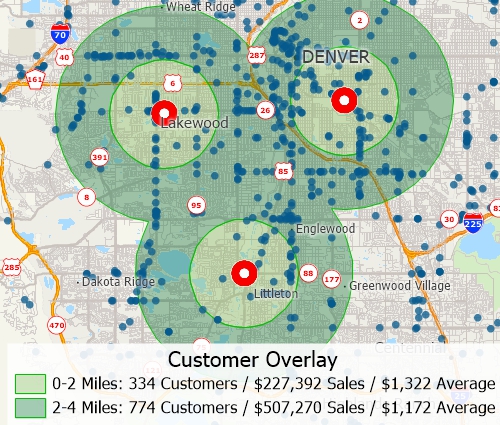
Geographic overlay is supported and allows attribute assignment between layers for aggregating point data or for aggregating and disaggregating attribute data based on percentage overlap of areas
Customize your maps to meet your needs. Maptitude lets you control what is displayed in your maps so you can taylor your message. Display maps at any scale, choose what features are visible, choose from an extensive assortment of map markers and line styles, customize labels with any field, font, or style, display satellite imagery backgrounds, and hide features outside of your study areas. When you are finished, you can save your maps as image files, print them as handouts or poster-size maps, or share them privately or publicly with Maptitude Online.
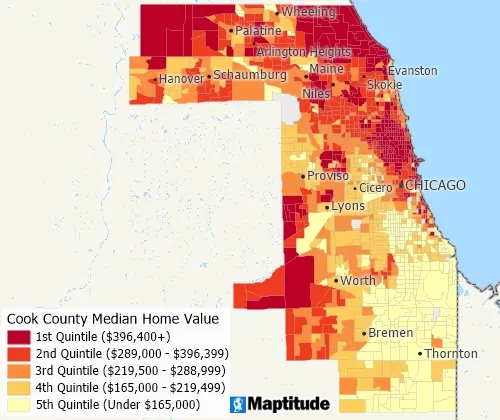
Classify data with quantiles, equal weight, equal interval, standard deviation, nested means, arithmetic or geometric progression, optimal breaks, categories, and manual classification
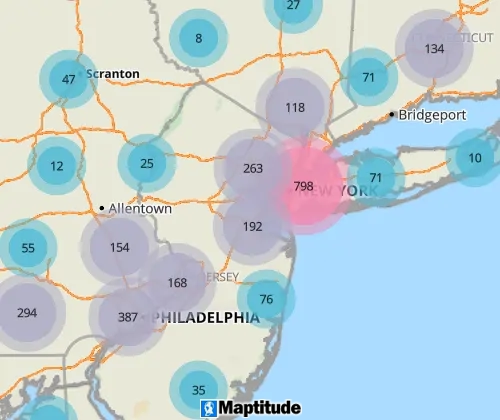
Share your geographic data as device independent and mobile-friendly interactive maps.
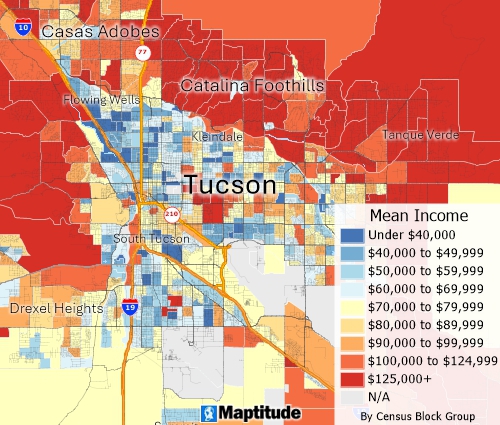
Includes detailed Census demographics to the Block Group level that can be used to esimate the characteristics around features, within territories, or within drive-time rings
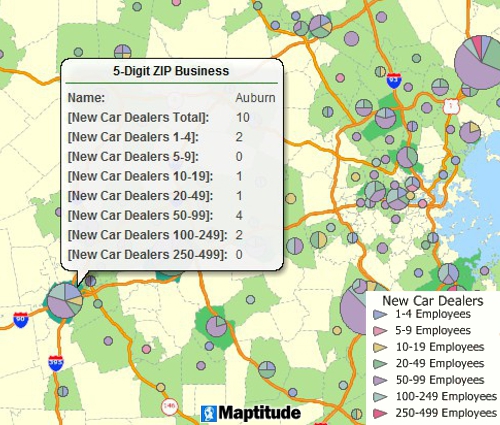
Includes detailed HERE and Caliper datasets of business locations and business count data by ZIP Code
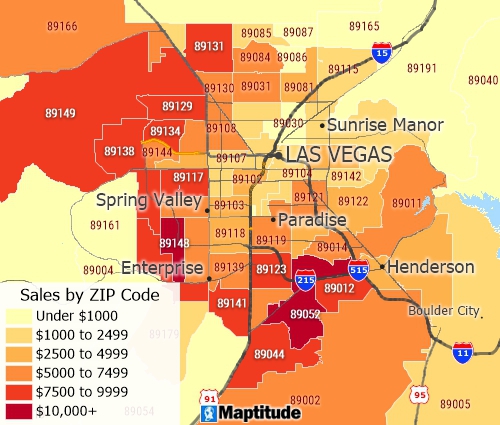
Aggregate your data to any of the included area layers such as states, counties, tracts, block groups, metropolitan statistical areas (MSAs), or ZIP Codes and add cities, highways, railroads, rivers, streets, or landmarks for geographic reference.
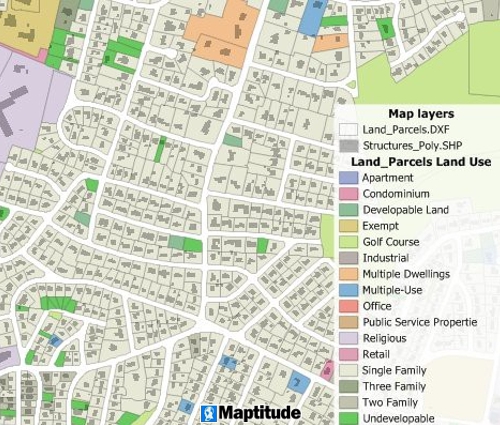
Supports dozens of database and spreadsheet formats plus GIS and CAD formats including Esri Shapefiles, MapPoint PTM files, Google KMZ, and Oracle Spatial
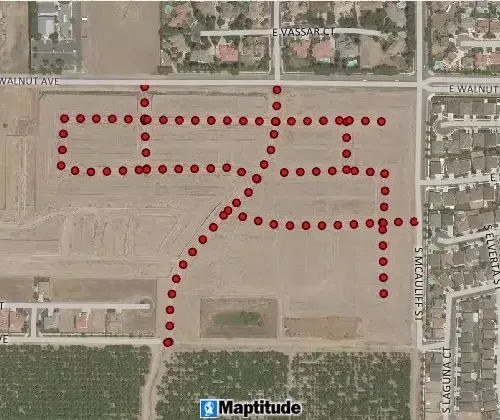
GPS support includes the ability to read/animate/import GPS data and create line and point layers from GPS data
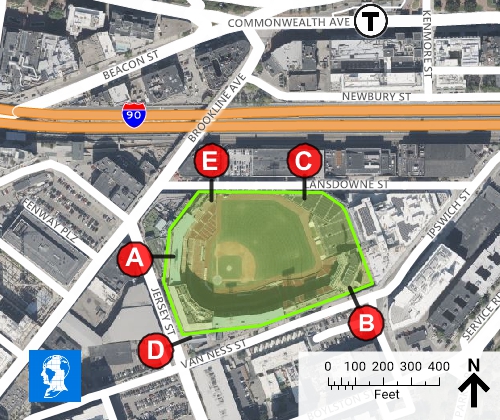
Customize a map legend, add a north arrow, draw callouts lines and shapes, add a title, show a great circle, or add images and logos
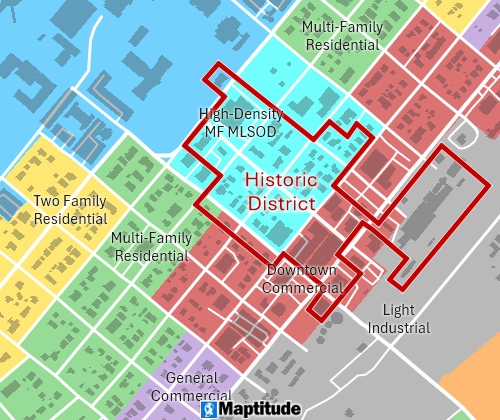
Create, update, and maintain features, including points, lines, polygons, and attributes. Conflation, clip/dissolve/merge/intersect/union, converting points-lines-areas, simplifying, automatic topology handling are all included.
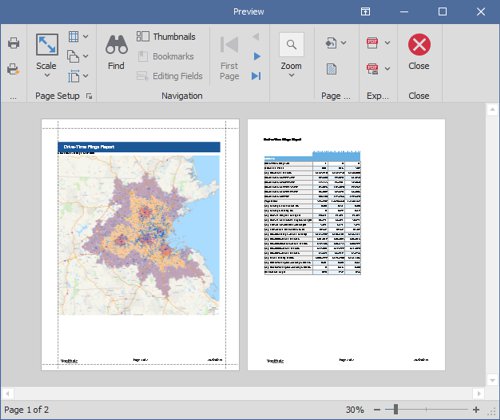
Generate detailed demographic, routing, and territory reports in Excel or PDF formats, with customizable layouts, automated area summaries, and large format printing
Learn more about Maptitude to see how you and your team can make informative and insightful maps!

Home | Products | Contact | Secure Store