Geographic heat maps are great tools for visually representing the density and distribution of data points across a map using colors and gradients. Areas with higher concentrations appear in warmer colors, making it easy to identify hotspots, trends, and patterns at a glance.
Maptitude geographic heat mapping software lets you create detailed and informative geographic heat maps that bring your data to life. Whether you're analyzing customer locations, sales density, or demographic trends, our advanced tools help you visualize complex geographic patterns effortlessly, enabling you to turn your raw data into clear insights for smarter decision-making!
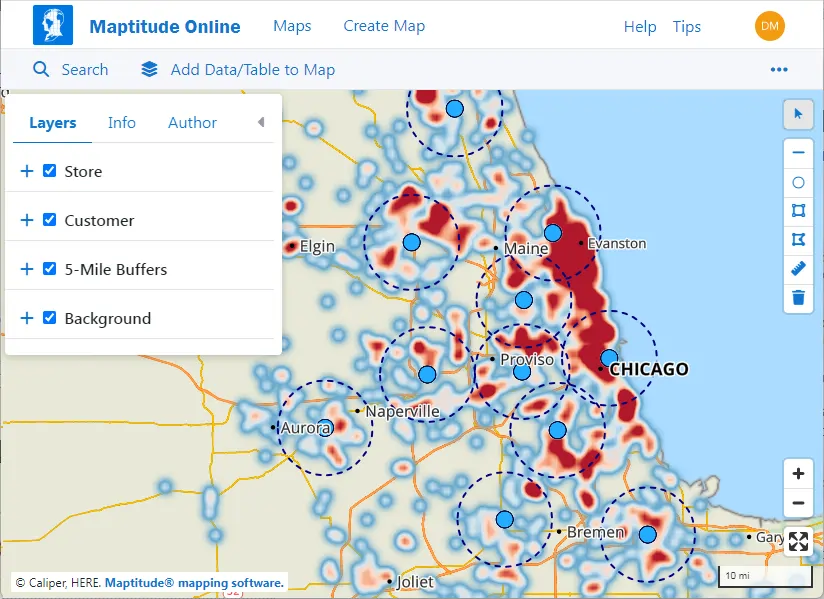
Maptitude Online heat map of customer concentration
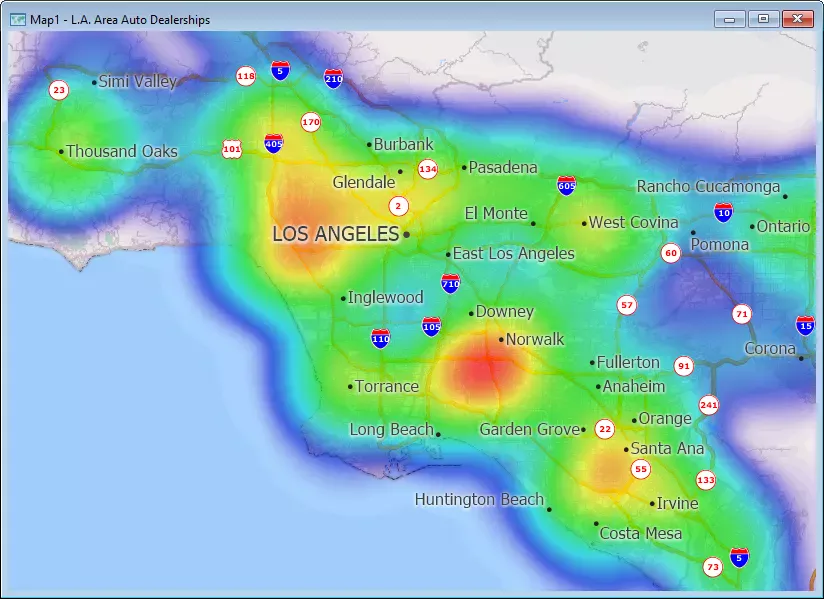
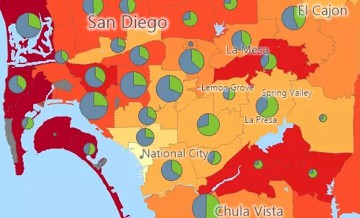
Maptitude Desktop heat map of automobile dealership concentration
Maptitude makes it easy to transform your location data into powerful geographic heat maps, helping you uncover patterns and make smarter decisions.
Whether you're analyzing customers, demographics, or business activity, Maptitude helps you visualize it all through high-impact geographic heat maps.
Maptitude Heat Mapping Software empowers you to make informed decisions by providing a clear visual representation of your data. Our software is designed to help you:
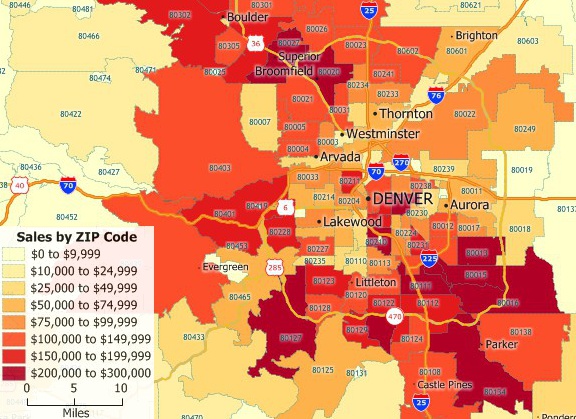
Create heat maps by ZIP Code with Maptitude heat mapping software
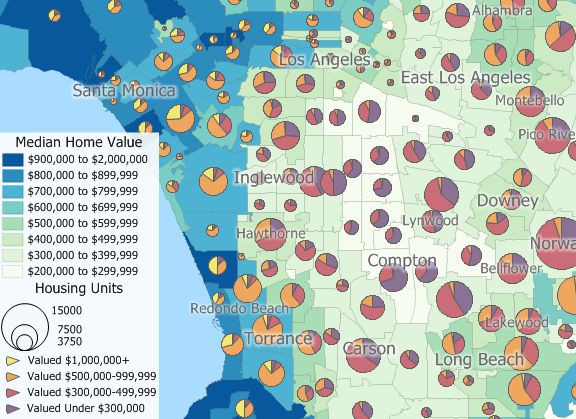
Creating heat maps, chart maps, and more is easy with Maptitude and the included demographic data
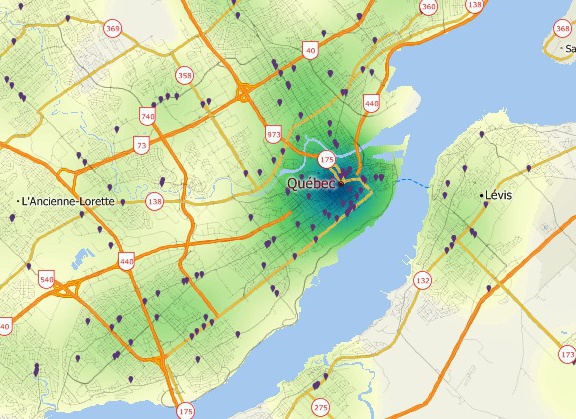
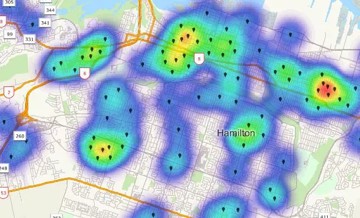
Geographical heatmap of point density
Maptitude supports heatmapping on multiple map layers
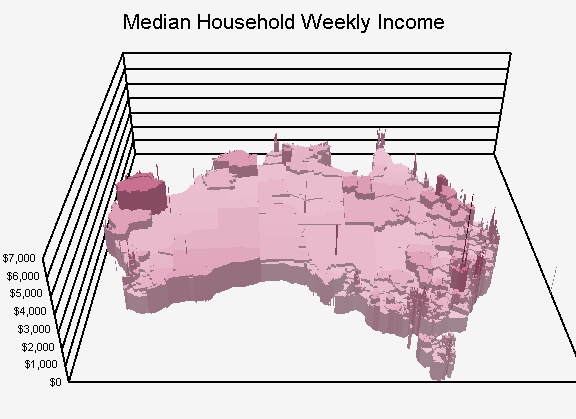
Create 3D heat maps with Maptitude heat map software
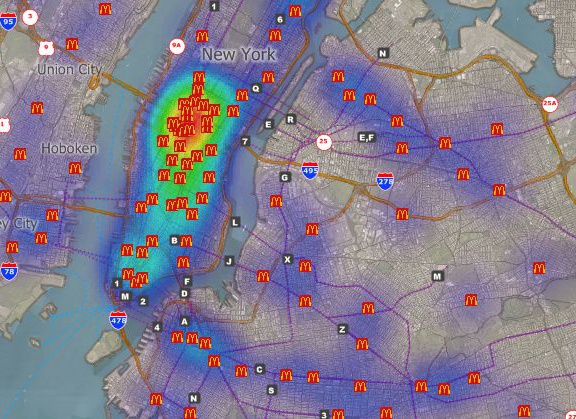
Hot spot heat map of New York City McDonald's locations
We believe that powerful mapping software should also be accessible. That’s why geographic heat mapping with Maptitude is user-friendly and competitively priced. You don’t have to sacrifice quality for affordability. Our mapping software is praised for its ease of use and comprehensive support, ensuring that you can start creating impactful geographical heat maps right away.
This interactive heat map shows where there are larger concentrations of private schools.
Want to see Maptitude in action? Our easy-to-follow tutorials will walk you through everything you need to start creating meaningful geographic heat maps. Whether you're visualizing sales density, customer distribution, or demographic trends, these videos provide the guidance you need.
Watch how to build and customize a heat map from your own location data. Learn to visualize data density, identify hotspots, and reveal geographic patterns across any region.
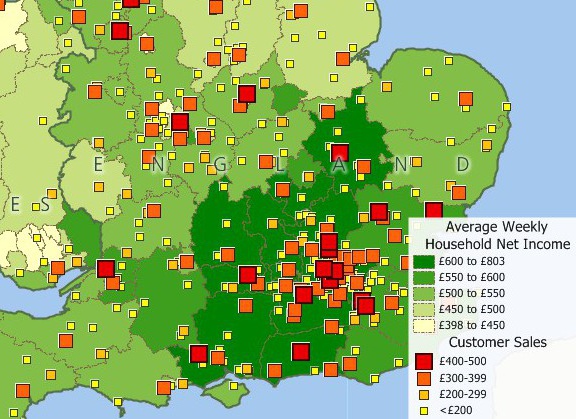
Discover how to create thematic maps that color-code areas based on data attributes like income, sales volume, or population. Ideal for market analysis, competitive research, and resource planning.
Join the multitude of satisfied customers who have chosen Maptitude mapping software to visualize their data with geographic heat maps. Experience the difference that a professional heat mapping solution can make for your organization. Start seeing better maps and better results – today!

|
“This is awesome mapping software. We use it to create heat maps of where our patients live. This allows us to intelligently decide where to add services in our area.”
|
 |
“Maptitude is user-friendly and provides all the tools necessary to produce effective maps and data analysis. Caliper's sales and technical support teams are knowledeable and responsive.”
|
 Check out our G2 Reviews
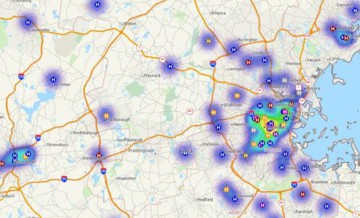
Home | Products | Contact | Secure Store
