Mapping Software and GIS Glossary
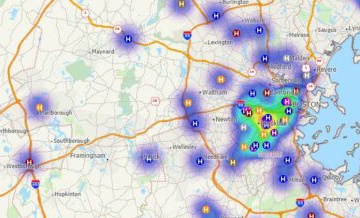
A density grid (or heat map) is a way to visualize and analyze point data by transforming the points into a regular grid. Each resulting grid cell is assigned a value that is determined by the density of nearby points, optionally weighting each point using a weighting value.
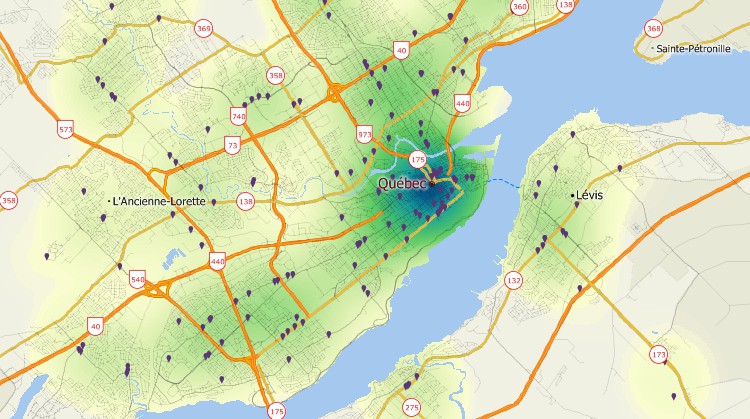
This density grid shows the concentration of customers, weighted by sales volume, across a city.
Density grids are useful for mapping crime data to show hot spot locations, mapping vehicle miles traveled to spot areas of congestion and higher air pollution, and analyzing the pattern of clients around a store weighted by the cost of their purchases.
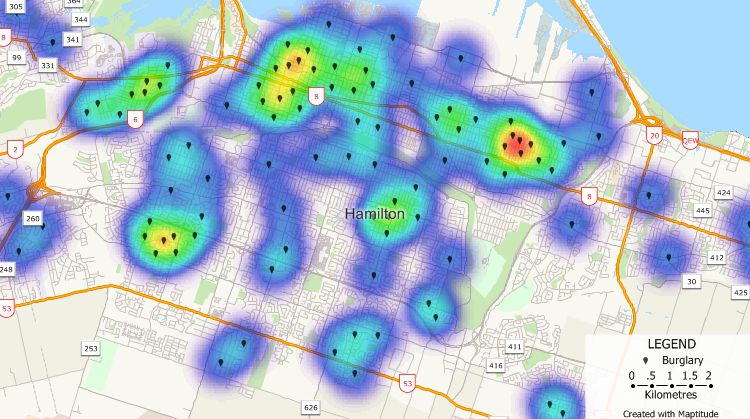
This density grid highlights concentrations of burglaries in a city and can be used for allocating police resources and crime prevention strategies.
Maptitude Mapping Software gives you all of the tools, maps, and data you need to analyze and understand how geography affects you and your business. Create informative density grid maps that illustrate the geographic component of your data.
Learn More Free Trial Free for Students/Teachers
![]()
![]()
![]()
![]()
![]()
![]()
![]()
![]()
Home | Products | Contact | Secure Store
