Last Updated: March 29, 2024
You can create several types of reports with mapping software.
In Maptitude, there are three types of reports: demographic reports, layout reports, and automated layout reports for areas.
Table of Contents
Automated layout reports for areas
Demographic reports
When you use one of the geographic analysis tools below, you have the option to calculate demographics and generate a report:
- Drive-time rings (Tools>Routing & Directions>Drive-time Rings).
- Buffers (Tools>Analysis>Buffers).
- Areas of Influence (Tools>Analysis>Straight Line Influence Areas).
- Overlay (Tools>Analysis>Overlay).
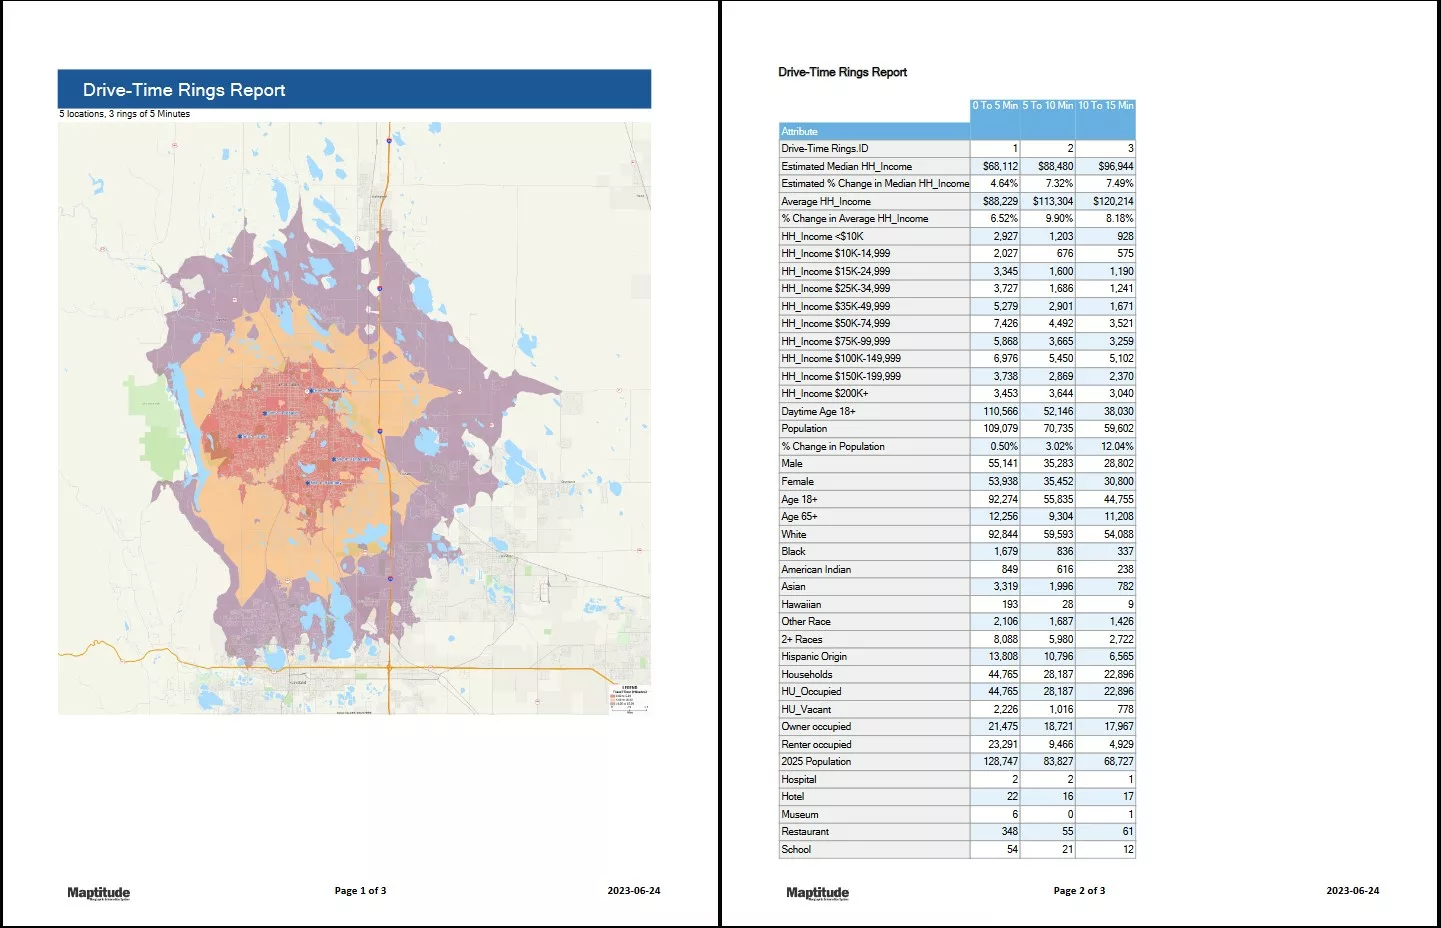
For a tutorial on creating drive-time rings, please see the Maptitude drive-time rings video tutorial.
For a tutorial on creating buffers, please see the Maptitude buffers video tutorial.
For a tutorial on creating areas of influence, please see the Maptitude areas of influence video tutorial.
If you’d like to calculate your own data in the demographic report, please see the Maptitude demographic fields learning portal article.
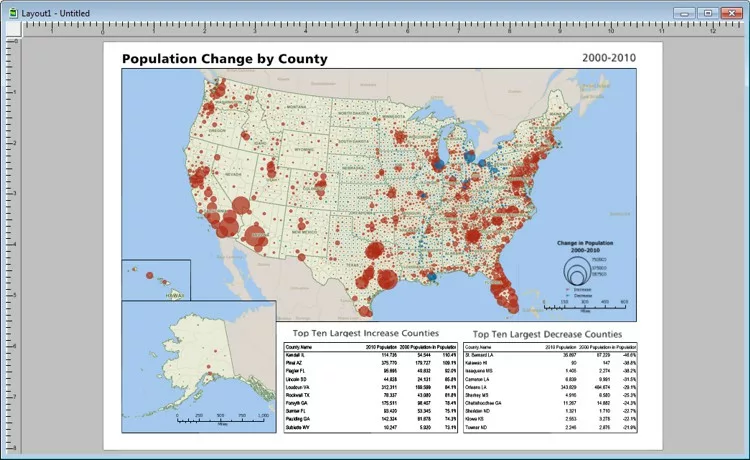
Layout reports
You can create layouts which allow you to customize the report yourself by adding and editing maps, tables, and charts.
To create a new layout report, go to Tools>Report>New Layout.
Optionally, you can export your layout to a layout file that can be used in your other workspaces.
To do this, you can go to File>Export>Image then save the file as [File Name].lay where [File Name] is the name of the layout file.
You can click and drag a layout file into the Maptitude window to add it to the current workspace.
For a tutorial on creating and editing layouts, please see the Maptitude layout video tutorial.
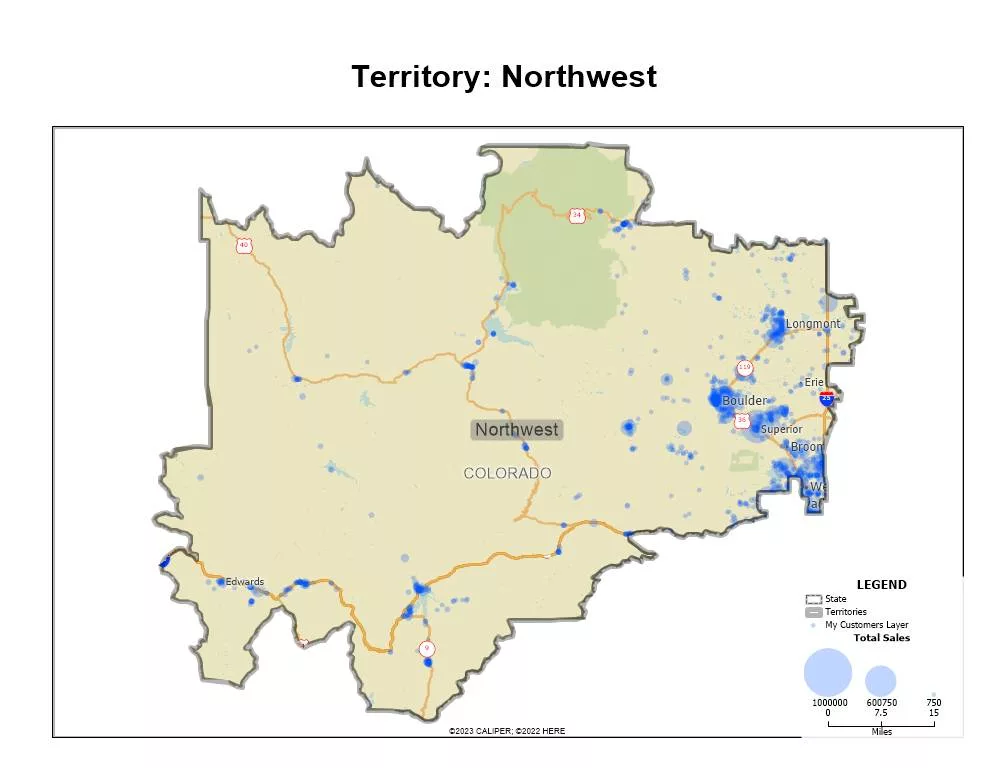
Automated layout reports for areas
Maptitude can generate pre-formatted layout reports for an area layer.
To create automated layout reports for an area layer:
- Make the area layer the working layer.
- Go to Tools>Reports>Automated Layouts for Areas.
Routing reports
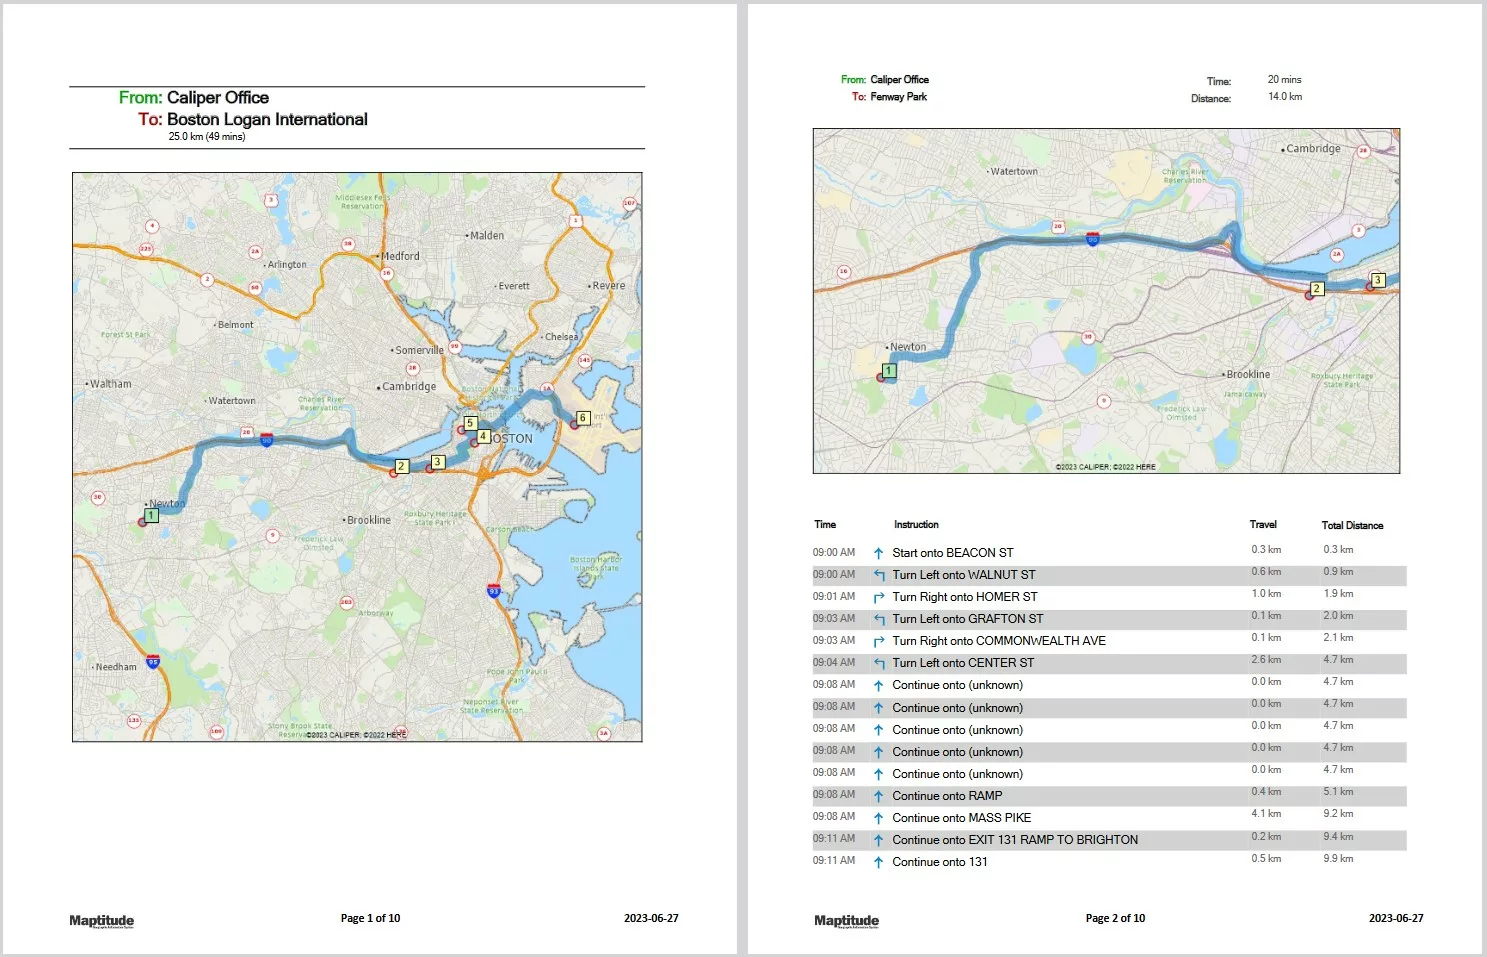
After creating a route in Maptitude, you can choose to export the results to two formats.
Clicking the PDF button in the Routing Manager or Routing Deliveries & Pickups Manager will create a PDF report with a route summary with directions for the route(s).
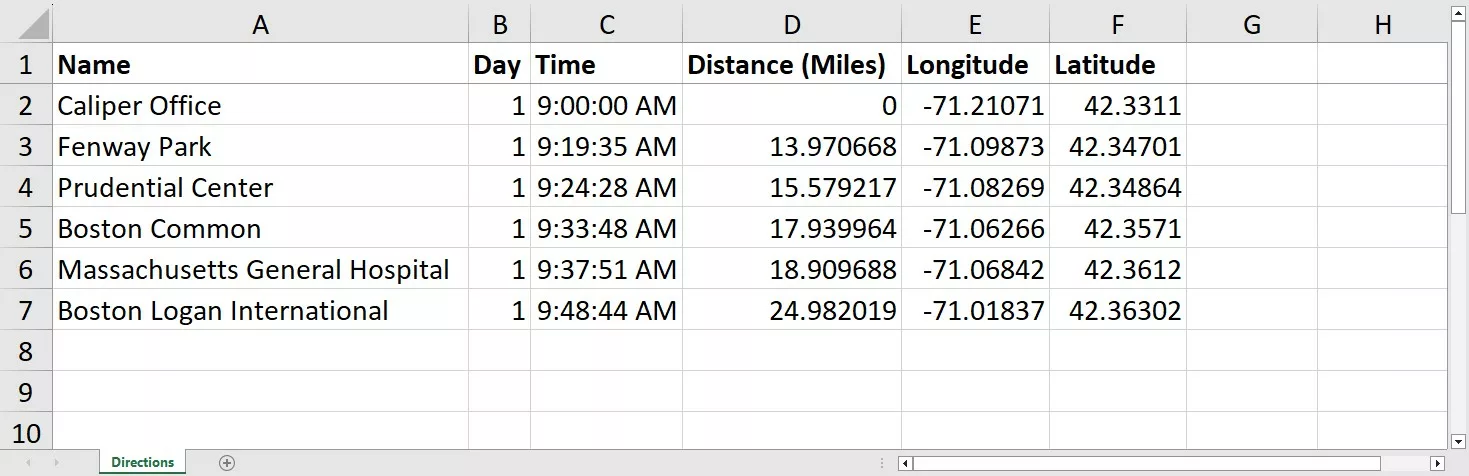
Clicking the Excel button in the Routing Manager or Routing Deliveries & Pickups Manager will create an Excel report that shows the order of stops and itinerary for the route(s).
If you are looking to create a single route, you can use the Routing tool in Tools>Routing & Directions>Routing & Directions Manager.
For a tutorial on using the Routing tool, please see the Maptitude routing video tutorial.
If you are looking to create a set of routes for deliveries and/or pickups, you can use the Routing Deliveries & Pickups tool in Tools>GIS Developer’s Kit>Add-Ins>Routing Deliveries & Pickups.
For a tutorial on using the Routing Deliveries & Pickups tool, please see the Maptitude Webinar on New Features in Maptitude 2022
Excel reports
There are several ways to create an Excel report with Maptitude.
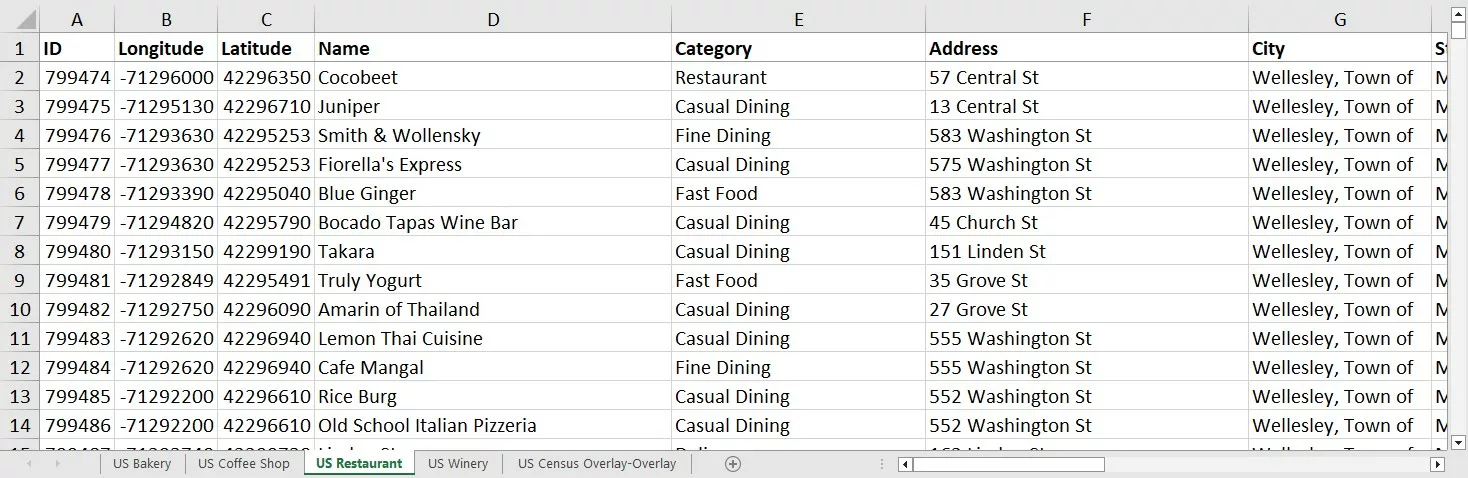
You can export the demographics and map features that are inside a drawing item by right clicking the drawing item and choosing Export to Excel.
You can export the demographics and map features that are inside an area layer (such as a drive-time ring layer) by making the area layer the working layer and going to Tools>Reports>Export to Excel.
You can export the demographics and map features that are inside a selection set of an area layer by clicking the Export Selection to Excel button in the Selection Toolbar.
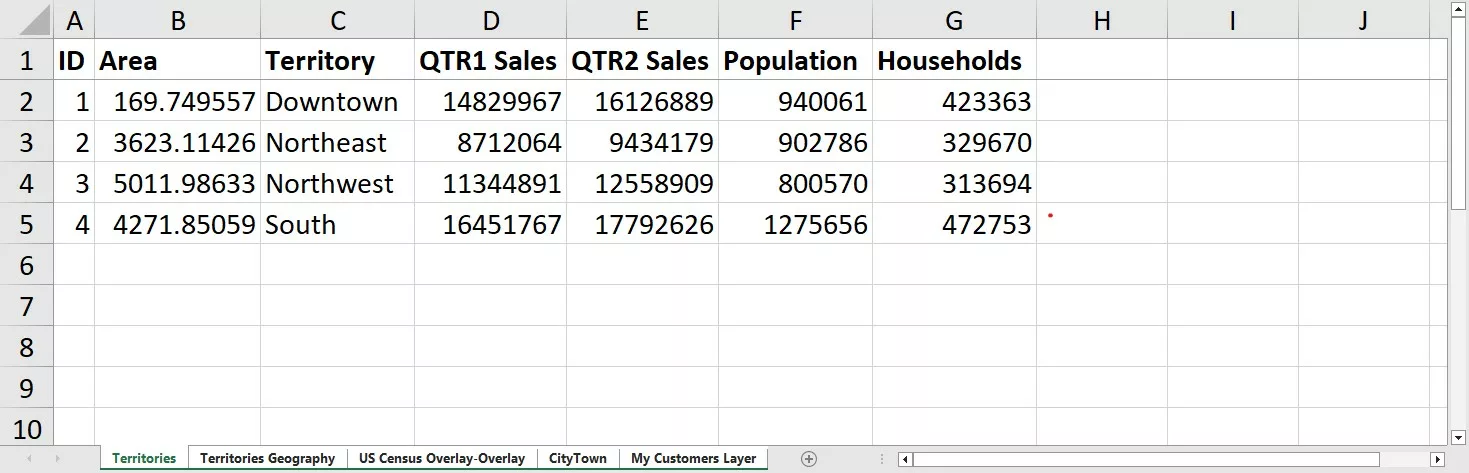
After creating a territory layer, you can export the demographics and map features that are inside one territory (or several) by right clicking the territory in the Territory Manager list territory (or selecting multiple territories and right clicking) and choosing Export Territory to Excel.
For a tutorial on using the drawing tools, please see the Maptitude drawing tools video tutorial.
For more information on exporting to Excel, please see the Maptitude Export to Excel learning article.
For a tutorial on using the selection tools, please see the Maptitude selection set video tutorial.
For a tutorial on creating territories, please see the Maptitude territory creation video tutorial.