Create maps that match your business needs with Maptitude. Whether you're visualizing customer data, drawing territories, or preparing reports, Maptitude gives you full control over the look, feel, and function of your maps. Use this guide to explore how you can customize maps to make your data more accessible, informative, and visually compelling .
Maptitude allows you to personalize the appearance of your maps by adjusting:
These visual tools help you clearly differentiate data categories, highlight key features, and align your maps with your brand or presentation needs.
Beyond basic styling, Maptitude includes advanced display options:
These enhancements improve both usability and presentation, especially when sharing maps with diverse audiences.
Use thematic mapping to display data-driven patterns. Maptitude lets you shade areas based on:
Choose from graduated colors, patterns, or charts to best represent your data.
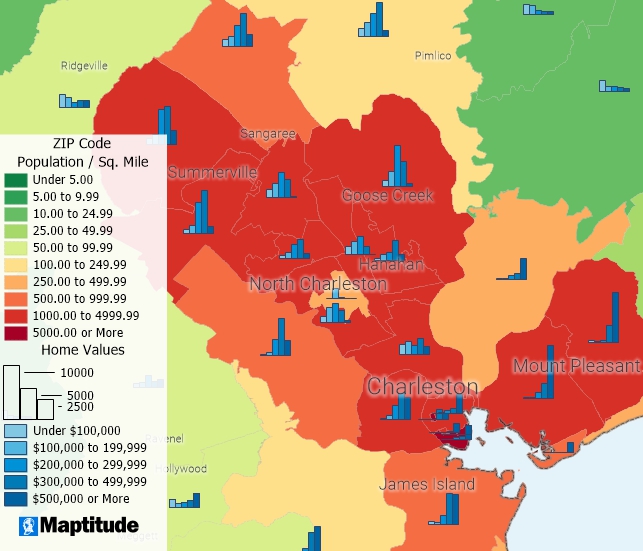
Color and chart themes can illustrate geographic patterns in your data. You have complete control of the colors and chart styles.
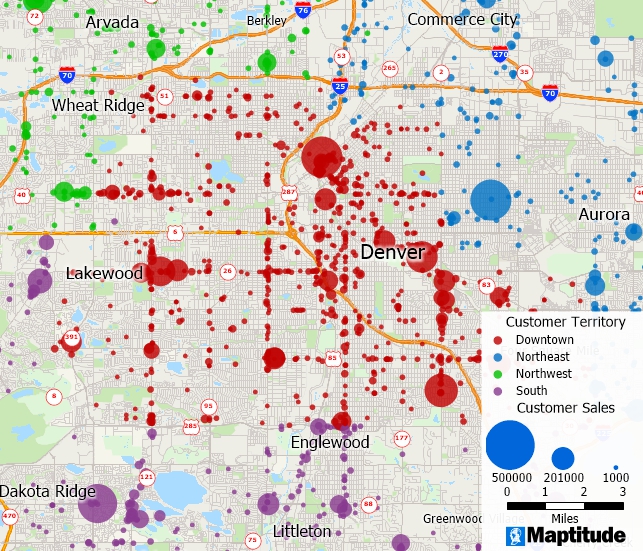
Customize the fill colors, sizes, and opacity of featuers with size and color themes to convey your message.
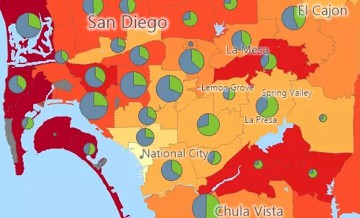
Heatmaps are ideal for identifying concentrations and activity levels. With Maptitude, you can:
This tool is especially helpful for marketing, logistics, or public services.
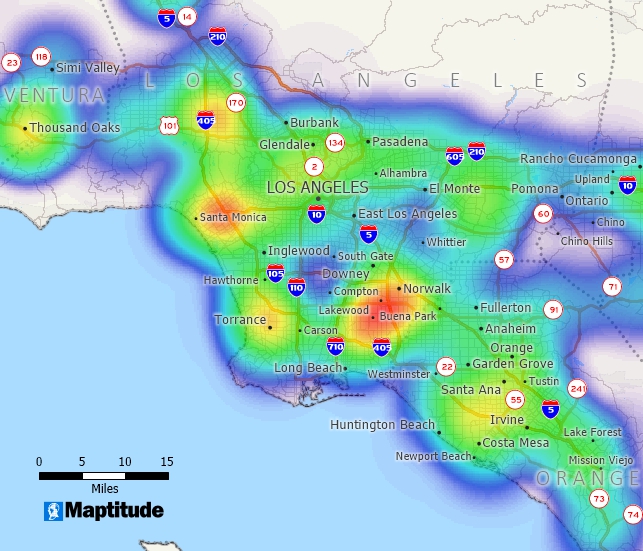
This heat map based on automobile dealerships in the Los Angeles area makes areas with many dealerships stand out.
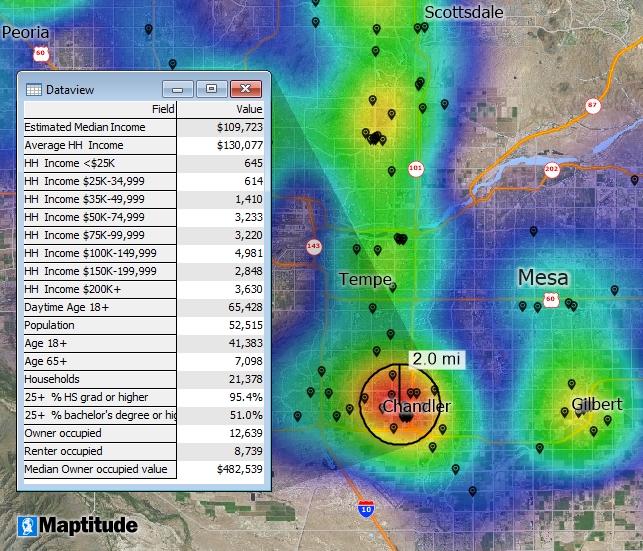
Overlay a radius on a heat map to identify the demographic characteristics of your primary audience.
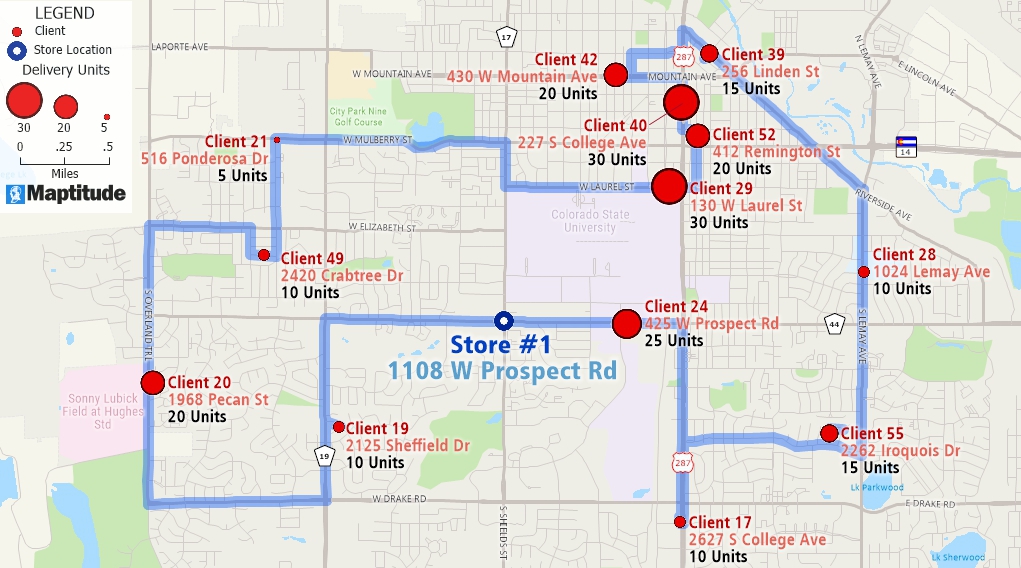
Maptitude can automatically label map features using values from your data:
Label styling options let you control placement, font, size, and visibility thresholds.
Use drawings to call attention to important areas. Add:
Annotations are useful for internal reviews, presentations, or reports.
You can import and overlay a wide range of formats:
Maptitude supports multi-layered mapping, letting you combine:
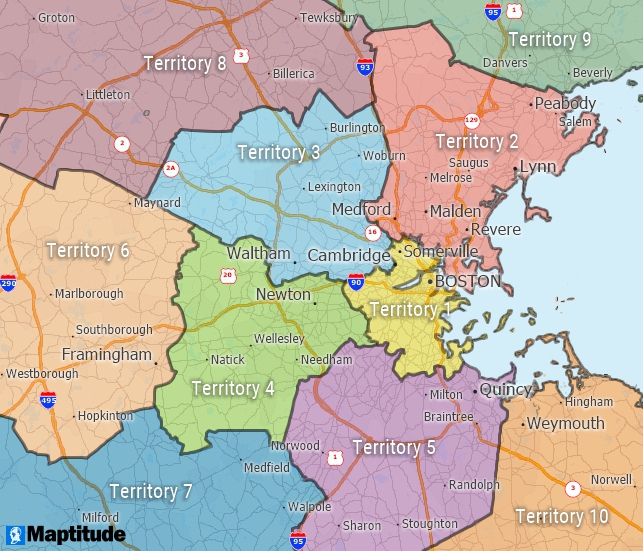
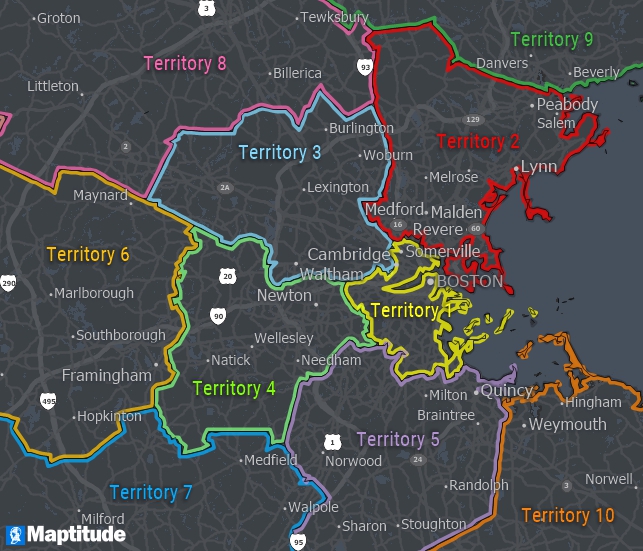
Draw or define your own territories using:
You can adjust these areas manually or based on business logic.
Maptitude includes demographic and economic data that lets you balance territories by:
This helps create fair, efficient, and data-informed service areas or sales zones.
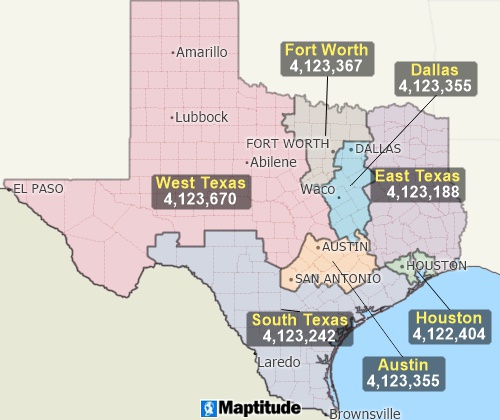
Create your own balanced territories based on demographic data, such as these territories based on population, or based on your own sales or customer data.
Getting started is straightforward:
Whether you're making a single-use map or reusable template, Maptitude keeps the process flexible and intuitive.
Maptitude offers the perfect mix of power, ease of use, and affordability.
 |
“Maptitude is incredibly user-friendly. It can be very intimidating to use a new geospatial tool without formal training. With Maptitude, I started with no training and quickly became the in-house expert at my company. We are locating new stores, optimizing existing footprints and quantifying local market opportunities. I learn something new every time I open Maptitude and it certainly has become the go-to tool for our geospatial analytics.”
|
 |
“Great product and customer support. Its extremely user friendly and the maps are easily customized to display the information our clients are most interested in. Their customer service is second to no one and they've always worked to resolve any minor issues I've ever had.”
|
No. Maptitude is designed for professionals without GIS backgrounds. Wizards and preloaded settings make it easy to build and style maps.
You can import Excel files, CSVs, shapefiles, KML, GeoJSON, and more. Maptitude geocodes the data and lets you immediately start customizing.
Yes. You can save map styles, templates, and themes for future use, which helps ensure consistency across projects or teams.
Need help? Explore our video tutorials or reach out to our team for personalized assistance.
Home | Products | Contact | Secure Store
