|
Maptitude for Redistricting is the preferred redistricting tool of state legislatures, political parties, and public interest groups. Live Demo Demo Video |
By Laura Slavin

What is redistricting and why should you care about it? Every ten years, district boundaries at many levels of government are redrawn in conjunction with the release of the Census Bureau’s official head count of all individuals residing in the United States. While redistricting of congressional districts attracts prominent attention in the press, redistricting is also performed for the election of state legislators and for the elected officials of county, city, and other local boards. The districts that are drawn directly impact the representatives that are elected and the decisions they make on behalf of you and the other residents of your community. Many of these decisions on budgets, policies, and investments will determine how your tax dollars are spent and what benefits are derived therefrom.
Shifting population totals lead to a requirement to redistrict – to redraw existing district boundaries – to ensure each resident has equal representation. Equal representation includes fair treatment in apportionment of public funds as well as a preservation of a one-person-one-vote relationship in elections. This is an approximate relationship in that only citizens have the right to vote and not all citizens choose to do so.
The timing and frequency of redistricting will vary by state and locality as each has its own laws and regulations that apply to redistricting. However variable, redistricting will be widespread in the U.S. after the 2020 Census data are released in August 2021. The redistricting data are limited to counts of population, population by race, and voting age population. The data are reported at the census block level, which is the smallest geographic unit used for tabulation. From the census block level, totals for larger units such as precincts, census block groups, census tracts, minor civil divisions, and counties can be readily computed and are also published by the Census Bureau.
When districting is done fairly, it helps ensure each vote is counted equally. Some common goals and requirements apply to redistricting at all levels. These principles are necessary to ensure fairness and compliance with prevailing laws. They, however, do not guarantee outcomes that will meet your objectives or anyone else’s. In contrast to past decades, most states are now planning to incorporate some form of public input or citizen participation in their redistricting processes. Those charged with local redistricting may also feel a commitment to provide public access. Public interest groups have historically played a role in redistricting or in challenging it and will be even more of a presence in the redistricting performed with the 2020 data.
Because there will be widespread public access to redistricting in the coming months and years, you are likely to have the opportunity to contribute your thoughts as to the best district boundaries. You do not even need to be a citizen or a voter to participate. However, if you wish to make a meaningful contribution to state or local redistricting, you will need to be armed with the right knowledge to make suggestions that are lawful and realistic.
In this guide, we will attempt to provide you with useful background information on redistricting and guidance on how you can be effective in contributing to the redistricting process in your locale. We will also provide examples that illustrate key points about redistricting principles and acceptable, fair districting solutions.
Due to the large amount of data involved, computer software such as Maptitude for Redistricting is used by redistricters to draw boundaries that meet legal and other requirements. Maptitude for Redistricting is intended for professional use and has a great many features and metrics that are relevant for creating and evaluating redistricting plans. You are not likely to have access to this software, but many governments and their consultants will use its companion product, Maptitude Online Redistricting (MORe), to provide public access.
The way publicly available map-drawing software, such as MORe, is implemented is at the discretion of the governmental entity, organization, or consultant that provides the web application. Depending on your locality, you may be able to contribute maps of your own creation to redistricting authorities, asked to comment on proposed plans, or criticize an existing plan. If you are reading this guide, you likely have some interest in redistricting. This guide is meant to be an accessible introduction to redistricting, particularly at the local level (e.g., city council districts, school districts, water districts, etc.)
We will focus on enhancing resident access and participation in the redistricting process and not on how to express your or anyone else’s political objectives. While there are many ways to define “fair” districting, there is no single definition, approach, or method that would be universally accepted. In some redistricting, political advocacy governs the process. We will not address political partisanship in this guide. We will however give you a way to understand if political motives are dominating the redistricting process in your locality. Also, we will focus on local redistricting and not on congressional redistricting, which by its very nature, is often substantially and inherently political.
If you are new to redistricting, you might begin with reviewing the current districting plan or considering the number and nature of the districts to be created. You might also want to familiarize yourself with the process that is used to choose or adopt an official redistricting plan. You may find that the group deciding which plan is best is intimately concerned with the outcome as it effects their own districts. In other instances, independent commissions, advisory commissions (which may be comprised of legislators, non-legislators or a mix thereof), or even courts may have the ultimate decision power. Incumbency is often a factor in redistricting even if the incumbents are not deciding the outcome.
At its core, a redistricting plan or solution is an allocation of census blocks or larger levels of geography to districts. These census blocks (defined in greater detail later) may include all those blocks in a census tract, neighborhood, precinct, town, or city. Generally, redistricters aim not to split smaller political subdivisions. So, for example, districts for a county board of supervisors will often keep towns in separate districts rather than splitting them apart in multiple districts. In general, it is important that there be roughly equal numbers of people in each district. For national congressional redistricting, house districts must be balanced to within a single person. For state and local districts, the permitted differential from perfect balance will be higher, and it will vary by jurisdiction.
A color-coded and labeled map showing the districts and their populations is a convenient way to display a redistricting plan, but an Excel file listing the census blocks in each district would be sufficient for an exact definition. In fact, any listing of the official IDs of the blocks in each district would be enough. A plan will have district population totals that can be compared with the target population and will thus have measurable deviations from the ideal balance of population. It is important to know the maximum deviation that is legally acceptable for the redistricting solution that you are working on.
Before beginning the redistricting process, it is useful to understand the data available to you and have a grasp of some basic terminology. Importantly, not everyone will have access to the same information. Many states explicitly require the use of Census data for legislative and/or congressional redistricting, but some do not identify specific data sources, and others specifically allow for the use of other data sources for redistricting, depending on the circumstances.1 For most localities, the 2020 headcount of the population will be highly relevant for redistricting. Also, it should be noted that it is the decennial Census that provides the geographic boundaries of census blocks, and that geography is relevant even if other attribute data are used for creating districts.
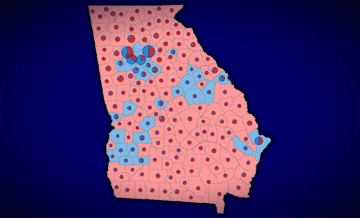
Census blocks are the smallest geographic unit used for decennial census tabulations. In urban areas, they are similar to a street block. Census blocks are generally bounded by physical features such as roads, rivers, or power lines but can sometimes be bounded by nonphysical features such as precinct (voting districts), city, or county boundaries. Each census block has a unique identification number that is assigned by the Census Bureau.
Census block groups are statistical divisions of Census Tracts comprised of census blocks and generally contain between 600 and 3,000 people.
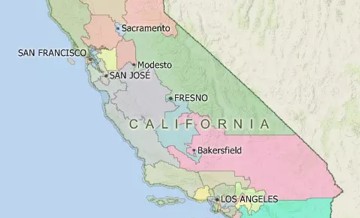
Census Tracts are small, somewhat permanent geographic entities within counties (or the statistical equivalents of counties) delineated by a committee of local data users. Generally, Census Tracts have between 2,500 and 8,000 residents and boundaries that follow visible features. When first established, Census Tracts were to be as homogeneous as possible with respect to population characteristics, economic status, and living conditions but that also is neither ensured nor even likely to be feasible. Census tracts were first defined in 1970, and the Census Bureau attempts to maintain them as consistently as possible across the decades.
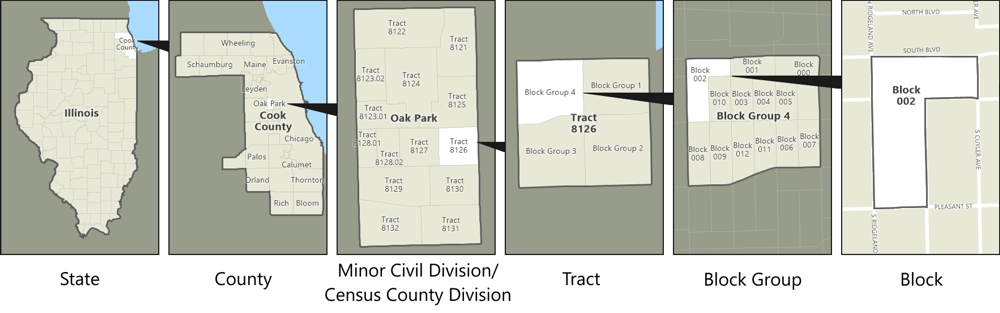
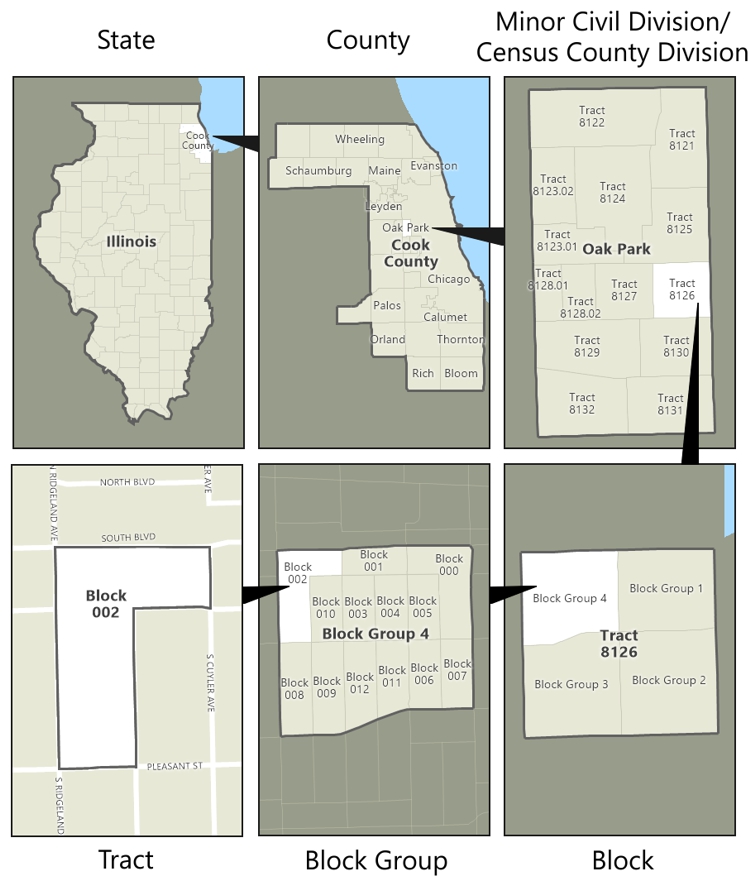
Understanding the Relationships Among U.S. Census Geography
The 2020 Census attempted to count every person living in the United States and the five U.S. territories. The 2020 Census enumeration reports counts of population by race, ethnicity, age, sex, and housing type. The Block level data are based upon a direct headcount obtained through a variety of means that attempts to be as complete as possible. Since there are difficulties in obtaining Census responses from all residents, some data are estimated for hard-to-reach populations. Generally, the headcount is an underestimate of the correct resident population due to difficulties in data collection and the reluctance of certain populations to provide the requested information.
Public Law (P.L.) 94-171, enacted by Congress in December 1975, requires the Census Bureau to provide states the opportunity to identify the small area geography for which they need data for the purpose of legislative redistricting. It also imposes time limits on the delivery of the data to each state’s governor and legislative leadership.
Requests for data for small area geography could include election wards and precincts and state house and senate districts. The data were to be provided within one year of the completion of the Census. Due to COVID, there has been a substantial delay and the data have been released in August 2021. When available, ward and precinct level data may be useful in redistricting.
The specific data items and breakdowns provided are as follows: Both the number of households and the number of people is reported in total and by age, numerous racial categories, and Hispanic ethnicity.
Race variables include the White alone population, Black or African American alone, American Indian, and Alaska Native alone, Asian alone, Native Hawaiian and Other Pacific Islander alone, and Some Other Race alone, as well as individual variables for the population of these same groups for two races combined through six races combined. The Hispanic or Latino and Not Hispanic or Latino by Race variables include totals for Hispanic or Latino populations and then separate them into populations of one of the aforementioned races alone or combined through six races combined. Race for the 18+ population includes population of one race and multiple races, again allowing for the possibility of a combination of up to six races. Hispanic or Latino and Not Hispanic or Latino for the 18+ population is broken down in the same fashion. Group Quarters population is divided into the institutional population and noninstitutional populations. The institutional population is subdivided into correctional facilities for adults, juvenile facilities, nursing facilities, and other institutional facilities. Noninstitutional facilities population is broken into college/university student housing, military quarters, and other noninstitutional facilities.
Typically, only a few of these data items are used in drawing district boundaries. Specifically, total population, voting age population, and summary race and Hispanic ethnicity data are frequently utilized but as we will explain subsequently, many other variations are encountered.
Of additional relevance are measures taken by the Census Bureau to modify the collected numbers from the 2020 Census with a complex mathematical algorithm that is used to implement "differential privacy." Differential privacy is intended to enable the public sharing of patterns in the data of groups while anonymizing the personal data of individuals. We do not believe that this form of privacy protection is either necessary or lawful or that the algorithm used is good enough, but you as a resident should simply understand that the population numbers reported for small geographic units may not be strictly correct. In fact, at the local level, counts of population by race and ethnicity at the block level are likely to be biased due to differential privacy. Differential privacy modifications to the headcount are being challenged in the courts, but it is not known if those challenges will be successful. Despite these issues, the published data will be used by most for redistricting as no better estimates are readily available.
In many instances, other data are used in redistricting. Some of these data may be locally collected, but much of the data come from the American Community Survey (ACS) that is administered by the Census Bureau on a continuing, monthly basis to residents of the U.S. The ACS takes the place of what used to be the long form in the decennial Census and is used to provide additional demographic data to characterize the resident population for many public policy analysis purposes. Small area data are only available from the ACS for a rolling 5-year period and only at the block group level and above due to the small sample sizes employed. Also, the margins of error (which are published) are very high at the block group level.
The most recent ACS data is based on surveys conducted from 2015 to 2019. As a survey sample, the ACS data do not establish the total population of any geographic area. However, they do provide a rather detailed albeit not current portrait of residents’ demographics by place of residence. Among the data published in addition to those from the headcount are tabulations of citizen status, country of origin, language spoken, housing characteristics including renter and home ownership status, education levels, and income.
In redistricting applications, the ACS block group level data are often “disaggregated,” or allocated to the Block Level. This might be necessary in some situations, but the methods used are, at best, approximate and will lead to even greater margins of error at the block level making these data potentially highly unreliable.
The Census Bureau has indicated that the 2020 ACS are compromised by low response rates due to the COVID pandemic and that there will not be an official release of these data. Instead, the data will be released as an experimental dataset. It is not known what the consequences of this decision will be for those who rely upon ACS as the best available estimates of small area demographics.
One particular dataset, the Citizen Voting Age Population by Race and Ethnicity (CVAP), is commonly encountered in redistricting and deserves special mention.
CVAP was originally published in in 2002 based on the 2000 Census for use in voting rights analysis. It has been cited by courts in measuring minority voting strength. After the 2010 Census, the Census Bureau began using the most recent ACS 5-year estimates to publish annual CVAP data. In February 2021, the U.S. Census Bureau published the CVAP based on the 2015-2019 ACS. CVAP data shows population of those 18 and older by citizenship status and race/ethnicity down to the block group level. The data also shows housing status.2 According to the Census Bureau, there will be a new release of CVAP in March 2022 that will also be based on ACS.
Plans are frequently challenged in court, so should you be successful in having your suggestions adopted, you should be prepared to have all your data subpoenaed during discovery. It is good practice to keep your maps labeled using clear and reasonable naming conventions.
A variety of other data may be encountered in redistricting applications. Voter registration data is available in many states and can be geocoded to the census block level providing information on the number of registered voters in each census block by party of registration. While these data are used by politicians for fund raising and other purposes, they may be precluded from use in some redistricting situations.
When available, voter registrations by political party can be used to evaluate competitiveness, a stated redistricting principle. Comparison of voter registration data with population data can be used to establish the percentage of potential voters in each census block. Data on actual voting participation and voting outcomes are typically available at the precinct (voting district) level. These data can also be disaggregated to the census block level.
Political parties also have large and potentially comprehensive data on residents and their personal characteristics. Data can be readily purchased on U.S. residents from commercial data vendors for pennies or less per record. One should not be surprised to find that some redistricting efforts privately use this type of information.
Another type of data relevant for redistricting but not always available or available in suitable form are demographic forecasts. Because districts are typically redrawn only once every ten years, the future composition of districts can be very important in choosing a good plan. While small area forecasts are not ubiquitously available, state demographers and local universities may have data on demographic trends that can be used in redistricting.
As a person participating in redistricting, it is important to have a bit of background on the laws and principles that govern the process. While it may be impossible to have a plan that is fair across all dimensions and according to all viewpoints, there are some universal principles that should be followed, bearing in mind your own objectives may be more nuanced.
1. Equal Population (One Person One Vote)
As stated above, a fundamental goal of redistricting is to create balanced districts in terms of total population. This is an essential aspect of fairness and equal representation of each person. For Congressional districts, balance needs to be as exact as possible, so districts cannot differ by more than one person. For state and local districts, a much wider tolerance may apply and could even be as high as a +- 5% difference.
In every districting problem, there will be a “target” or ideal number of people per district. This is calculated by dividing the total population of the area to be districted by the desired number of districts or representatives.
Based on the 2020 apportionment data released in April 2021 by the Census Bureau, the target value for each congressional district is 761,952 (total population of 331,449,281 people divided by 435 house districts).3
One may wonder why the ideal value is based on the total population as opposed to the number of citizens or the number of voters. Although those unable to vote, including non-citizens and children, are included in the population, federal funds are apportioned based on population, not voters.
An accurate head count is essential in ensuring fair districting. If people do not respond to the Census or are excluded from it, equal representation will not be possible. In some states, prisoner populations are counted at the prison locations and in other states prisoners are re-allocated to their former place of residence.
The population is always changing. While, in general, population in the U.S. is growing, there are states, regions, and towns where it declines. Shifting population totals lead to a requirement to redistrict – to redraw existing district boundaries - to ensure equal representation.
In some local jurisdictions, balance can be obtained using measures that are different from total population, such as voting age population.4 It is important to understand what the expected goal is in each redistricting effort.
2. Prohibition of Racial Discrimination
Federal law prohibitions of racial discrimination in voting rights applies to redistricting. The Equal Protection Clause of the 14th Amendment prohibits states from denying anyone, regardless of race, equal protection under the law.5 As applied to redistricting, this amendment prohibits those drawing the maps from separating people into different voting districts due to race.6 The Voting Rights Act of 1965 ("VRA") also prohibits racial discrimination in voting. Section 2 of the VRA prohibits the denial of voting rights due to failure to pass a literacy test7 as well as "vote dilution," in which the strength or effectiveness of a person's vote is diminished8 based on race, color, or language spoken.
There are instances in which the votes of minority populations have been reduced in influence through use of at-large districts or by "cracking," "packing," "stacking," or “fracking” districts. In an at-large election, all representatives are elected by the entire voting constituency. As a result, minority populations may have difficulty in electing their candidate of choice. Some states, such as California, have prohibited at-large elections in political subdivisions if they would impair the ability of a protected class to elect candidates of its choice.
Cracking of high minority population districts dilutes minority votes by breaking up a contiguous district that is composed of a majority of a racial or ethnic minority. Conversely, packing reduces minority voting power by cramming minority group members into a single district when that group may be able to produce a majority share of votes in more than one district. Fracking occurs when a county, city, or other well-established political subunit is purposely split in two or more discontiguous parts of the same district. Fracking is another method by which minorities can be packed into a single, albeit not highly compact district.
Stacking involves betting on low voter turnout of low-income, relatively less-educated minorities by combining them in a single district with wealthier, more educated white voters who will have a voting majority due to higher registration rates and voting turnout.
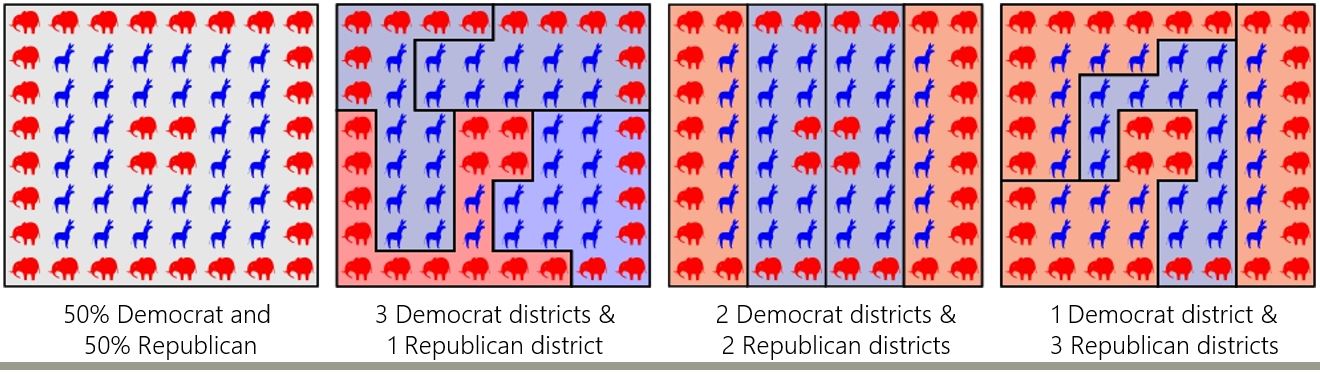
How Legislative Boundaries Influence Partisan Representation
To prevent vote dilution, "majority-minority" districts can be created and maintained. A majority-minority district is one in which one or more racial minorities comprise a possible voting majority of a district’s total population. A vast number of possible plans can always be created, and it is difficult to know the maximum number of majority-minority districts that can be created. The law is not clear and cannot logically be clear with respect to what percentage majority is needed to constitute a majority-minority district. For example, minority voter participation may be low, so a much greater than 50% majority may be necessary. Moreover, the consonance and diversity of views in a minority group is an issue as is the basic question of whether or not different minority groups are allied in voting. It only makes sense to group different minority groups together to form a majority minority district if those groups tend to vote similarly.
"Minority-opportunity" districts are districts in which a minority candidate could be elected even if the minority population is far from a majority. This can easily happen when white voters support minority candidates. There are also instances in which minority groups may have deciding influence when their votes are combined with others. Recently, some have drawn attention to the argument that creating minority-opportunity districts as opposed to majority-minority districts expands the minority voting power. They argue that, in districts where fewer than fifty percent of a minority population is required to elect the minority candidate of choice, creating two or more districts in which minorities represent a smaller but still considerable share of the vote, would lead to broader minority representation. In contrast, packing minorities into a single majority-minority district, which may have once been necessary to elect a minority candidate of choice, may lead to "white washing" of adjacent districts.9
Minority coalition districts are another mechanism for improving minority representation. Minority coalitions districts are those that combine multiple minority groups to create a majority-minority district. Although different minority groups sometimes share views on various political issues, this is not always the case. In areas where one minority is well established, that group can be resistant to supporting new immigrant groups. Blacks and Latinos do sometimes vote similarly but their votes may depend on specific issues. Moreover, research has shown that Latinos have joined with blacks to vote for a black candidate, but the reverse occurs less frequently. In fact, whites sometimes ally with blacks to oppose Latino candidates. Endorsements by influential leaders are often significant.10
Assessment of the potential for minority coalitions will often be an inherently local matter. As such local knowledge and insight and evidence from prior elections can be pivotal in assessing the potential for such alliances.
There has been disagreement in the courts over the ability of minority coalitions to challenge the legality of redistricting plans under Section 2 of the VRA. Critics of aggregation argue that each protected group much make the claim of vote dilution separately, stating that the coalitions are a major departure from the intent of the VRA. Proponents of coalitions argue that nothing in the VRA prohibits them, and they are aligned with the VRA’s purpose of prohibiting racial discrimination.
To successfully make the case for vote dilution in court, the combined group must be sufficiently large and geographically compact to constitute a majority in the district. It must be shown that the group votes similarly. And it must be demonstrated that a white majority of votes would tend to defeat the combined group barring special circumstances.11
While the principles described above are legal mandates, there are other best practices that should govern the redistricting process. States have prioritized certain principles over others, and some principles may even be in direct conflict with others. Redistricting laws and principles do not provide a blueprint for how redistricting should be done; they either identify certain practices to be avoided or constraints that should be respected.
1. Compactness
In general, compact districts are to be preferred over those with very irregular shapes. Districts that are not compact are easy to spot on a map. They are irregularly shaped and may indicate intent to discriminate against a group by packing them into a particular district. In general, higher levels of compactness are encouraged. Various metrics have been developed to measure compactness. However, the simple “eyeball test” is also a frequently used measure. Compactness is technically defined as having the minimum distance between all the parts of a district. (a circle, square or a hexagon are examples of very compact districts). In MORe, Reock compactness scores are provided as a metric. A Reock score is calculated by dividing the area of the district by the area of the smallest circle that would completely enclose it. This value will always be between zero and one because the In this example of Congressional Districts in Texas, District 8 is relatively compact, while District 15 is not. area of the circle will always be larger than the area of the district. The closer a Reock score is to 1, the more compact the district.
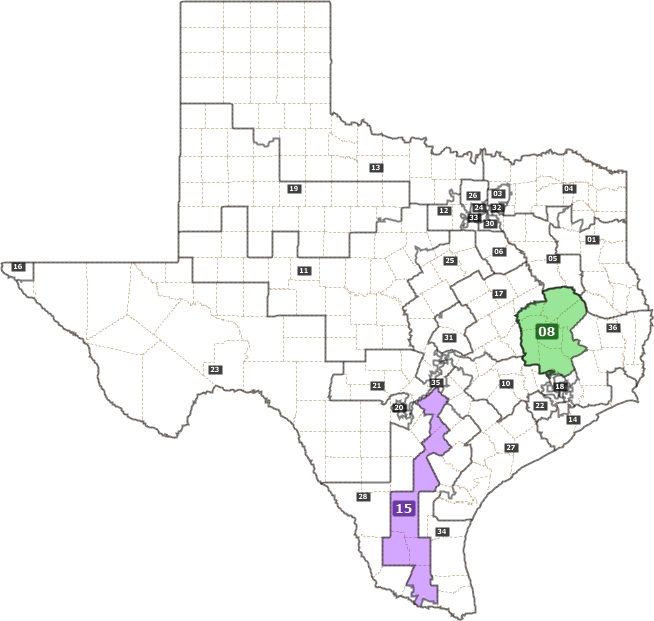
Congressional District 8 is more compact than Congressional District 15
2. Contiguity
A portion of District 18 was added to District 7 to provide an example of a non-contiguous district. Contiguity is defined as all parts of a district being connected geographically with the rest of the district. You can generally spot a non-contiguous district by noting that it is in several separated areas and not in one piece. Another definition encountered is that of “travel contiguity,” which is defined as being able to travel from any point in a district to any other point in the district without having to leave the district. This can be assessed with tools provided in the desktop Maptitude for Redistricting.
In some cases, contiguity requirements allow bodies of water to sit between two parts of the same district. For example, in Hawaii, districts include more than one island, and are considered contiguous. In other instances, water cannot divide a district for that district to be considered contiguous. Whether a single point connecting two pieces of a district (i.e., point contiguity) is sufficient may depend on state or local guidelines.
Contiguity can be thwarted by political jurisdictions that are themselves in multiple, separated areas due to annexation. In these situations, it may not be possible for all districts to be contiguous.
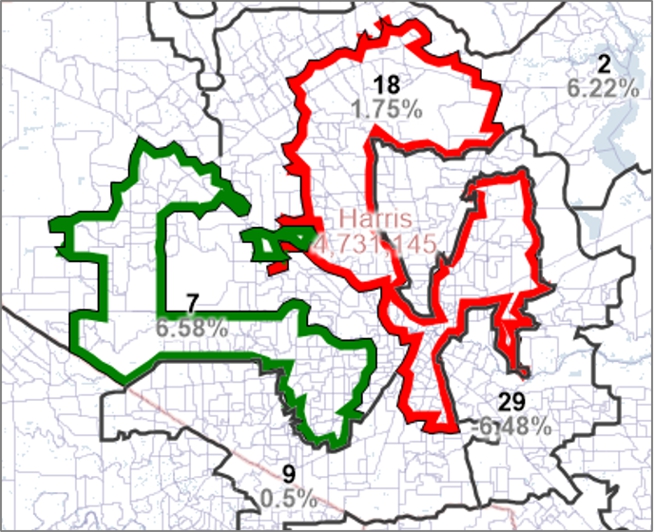
A portion of District 18 was added to District 7 to provide an example of a non-contiguous district.
3. Preservation of Political Subdivisions
States often have the goal of keeping counties and other smaller political subdivisions, such as cities and towns, together when redistricting. This measure can be quantified by counting the number of counties or other subdivisions that are spit between two or more districts.12 Also, nesting is sometimes required as a matter of state law. Nesting is the practice of using the boundaries of districts for one elected body such as the senate to bound the more numerous, smaller house districts of the state legislature. In county redistricting, keeping towns intact, when possible, may apply.
4. Preservation of Communities of Interest (COI)
In addition to keeping political subdivisions intact, map drawers are sometimes encouraged to keep groups together that may have similar positions on issues and are likely to vote similarly. These communities of interest, COIs, do not necessarily coincide with the boundaries of a political subdivision but may include neighborhoods of a city or regions of a state where the residents have common demographic characteristics and/or shared political interests.13 COIs are particularly important for groups that have traditionally been left out of or are underrepresented in the political process. Without preserving COIs, policymakers may fail to hear the concerns of these groups. Examples may include neighborhood residents organizing around issues, such as having a school built closer to their area or a nearby coal-fired power plant closed. Race and ethnicity can play a role in defining a COI but cannot be the sole identifier. Importantly, to be valid, a COI’s shared interests should have a meaningful relationship to the entity to be redistricted. For example, shared interests about educational policy are relevant to school districting, but not likely to be relevant in drawing water districts.
Creating COI is not an exact science and creating them can be in direct conflict with other redistricting principles such as compactness and keeping political subdivisions intact. Multiple methods for defining COIs more consistently have been identified. Preventing districts from dividing census tracts, which could act as a proxy for COIs, as they tend to contain groups that have similar demographics, is one idea. However, similar demographics do not ensure shared views on diverse issues. Others have suggested requiring the use of public testimony to define COIs. Persuasive explanations of a community of interest should be provided to support their use.
California has provided the public access to a COI Tool: https://www.oc-breeze.com/2021/03/03/194416_2020-california-citizens-redistricting-commission-launches-communities-of-interest-tool/ Along with the ability to submit a map of your COI, the user is prompted to provide qualitative information, such as community name, shared interests, and nearby areas to exclude or exclude. Submissions are anonymous.
5. Substantial Preservation of Existing District Boundaries
Many map makers begin with prior district maps to create a sense of continuity and minimize unnecessary changes. In fact, several states explicitly list the preservation of prior district boundaries as a criterion of redistricting.14 Of course, if there were only minor changes in district boundaries then redistricting would serve the interests of incumbents.
6. Avoiding Pairing of Incumbents
Some states require that those drawing the lines not place incumbents in the same district, so they are forced to run against each other in a newly created district.
7. Creation of Competitive Districts
Some states require that district boundaries be drawn in a way to encourage interparty competitiveness. A simple way to determine whether a district is competitive from this perspective would be to tabulate voter registration data. Here too, voting participation may also be relevant.
8. Prohibition of Use of Political Data
Several states, however, are prohibiting the use of political data, including party affiliation and voter history. In a state that prohibits use of political data, maintaining interparty competitiveness, therefore, may be difficult.
9. Not Favoring Political Parties or Incumbents
Whether a redistricting plan is neutral with respect to political parties or incumbents can be hotly debated. Florida’s constitution, for example, contains this language, but does not prohibit use of political data.
These principles and associated tests have been created to discourage gerrymandering practices, that is manipulating district lines to maintain or obtain partisan political power. It is impossible to adhere perfectly to all these principles. So, some must be prioritized over others. Sometimes, one principle may be in direct conflict with another. After legal requirements are met, there need not be any prioritization of principles and the political process may govern outcomes.
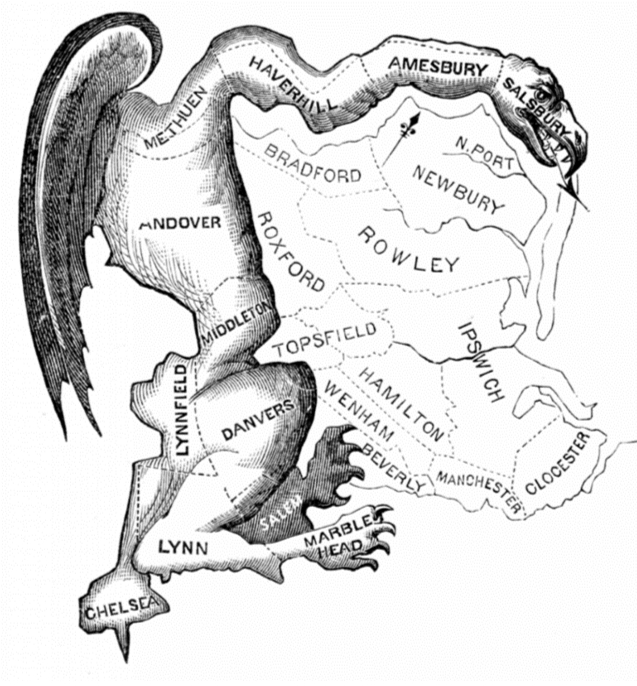
Most reading this guide have likely heard of the term, gerrymandering, but may not be aware of its origins. The term, gerrymandering, the political practice of redrawing district boundaries to favor a particular political party, originated in 1812. That year, Elbridge Gerry, governor of Massachusetts, approved a state senate map that a political cartoonist thought resembled a salamander. It also happened to dramatically advantage the Democratic-Republican party, which controlled the State legislature. And so, the term was borne.15
More recent examples of Gerrymandering include Ohio's "Lake Erie Monster" and Pennsylvania's "Goofy Kicking Donald Duck."16
Gerrymandering is used to favor political parties, and it can also facilitate discrimination. Certainly, it is often an instrument of incumbent protection even when practiced by a single political party.
Regardless of the level of government involved, there are a vast number of possible combinations of census blocks that can be divided into districts. While finite, the number of plans can easily be greater than the number of electrons in the universe. Even though the application of redistricting principles of balance, contiguity, and compactness will reduce the possibilities, there will still be a vast array of possible alternative plans. As a result, it is impossible to compute all of the alternatives and evaluate them.
This should bring a deep sense of humility to anyone who proposes a plan, because she or he will not be likely to know if there is an obviously better alternative possible whatever the evaluation criteria.
Due to the principle of population balance, districts will be smaller in densely populated areas and larger in low density areas. This will make it easier to incorporate whole political units in rural areas and likely impossible to do so in dense urban core areas.
Plans will differ significantly based upon the starting points or centers chosen for one or more districts. Varying the starting points or centers used can be a good way to try to produce better plans.
There is no simple way to determine the number of minority-majority districts that are possible in a redistricting plan. However, when there are issues of proper representation, it is important to try to create one or more of these districts, or your plan will be likely to be rejected if it does not. You should know how many minority-majority districts were previously present as a reduced number of them would make a new plan problematic.
Non-partisan redistricting conducted without any consideration of partisan politics or political data is not immune from having partisan consequences. For this reason, it can be important to evaluate plans for partisan disparities. Ironically, to do so requires using political data. Since you do not control what data is used in MORe, you might need to ask someone with Maptitude for Redistricting for redistricting and voting data to assist with assessing political biases or voting rights act problems.
It is hoped that public access and participation in the process will increase the diversity of the plans considered and improve the quality of plans adopted. In the past, there have several examples in which plans submitted by the public have been either adopted or have influenced the plans that were adopted.
Absent obvious defects and biases, it can be difficult to judge a redistricting plan or to compare alternative plans. There is no one right answer, nor is there just one metric that can be used.
In many cases, better plans will be more closely balanced and more compact barring specific defects or conflicts with other redistricting principles.
Since no one single metric can fully rate a plan, it would be logical to use multiple objectives and criteria. Developing a plan that is fairest to all constituents is a reasonable goal but that of course is hard to measure.
Every time MORe is used for public access, an administrator will have a copy of Maptitude for Redistricting as it is used to set up the MORe application. Maptitude for Redistricting has many additional plan metrics and can be used to evaluate many more alternative plans. In particular, Maptitude for Redistricting also enables users to evaluate their plan in comparison to numerous randomly generated plan and potentially identify biases and areas for improvement. You might request that some of this additional analysis be performed and that interesting plans be published on the web for public access.
In the previous redistricting cycle, map drawing technology was available to and understood by only consultants and party insiders. In 2021, sophisticated map drawing capabilities are available to all. You, as a member of the public, may have decided to participate in the redistricting process in a variety of capacities depending on your state/locality. You may have been invited to propose maps of your own to redistricting authorities, asked to comment on proposed plans, or criticize an existing plan. Even at the local level, your participation in the redistricting process may prove crucial in ensuring fair outcomes.
Though you have been permitted to comment on or even present maps of your own, it is important to know who is ultimately responsible for approving the redistricting plan in your jurisdiction. In congressional redistricting, State legislatures usually control the process. At the local level, there may be a board or governing body comprised of incumbents or other community leaders who make the final decision. If you are part of a redistricting commission, your commission most likely falls into one of three broad categories: (1) Commissions with primary responsibility for redistricting, (2) Advisory commission that draw and submit maps to the legislature or other governing body, which is ultimately responsible for approving a final plan, or (3) Backup commissions that are formed if the legislature/other governing body fails to meet a redistricting deadline.
The same principles that apply to state and congressional redistricting also apply to redistricting at local levels.17 Local redistricting could include city council districts, school board districts, court districts, water districts, and other state entities. The principles above are helpful to consider when drawing or evaluating your plan. The materials presented below will help you put them into practice using a powerful software tool, MORe. MORe makes it easy for citizens without prior GIS or redistricting experience to evaluate existing plans, edit them, or even create new ones. This guide is intended to help you evaluate plans presented to you by legislators, redistricting commissions, or others. For more explicit step by step instructions on how to use MORe, please refer to the Quick Start Guide, the Help or this instructional video from Doug Johnson, President of National Demographics: https://www.youtube.com/watch?v=NCpU33wPkNo
Public access and public participation in the redistricting process should be regarded as an essential part of our democracy. Local knowledge and insight are important and often will be better represented in input from residents than from their representatives. We encourage you to contribute to a fair redistricting process in the best way you can.
This is Version 1 of the "People’s Guide." It was prepared prior to the release of the 2020 Census data. It will be updated from time to time to reflect new developments in redistricting and updates to the Maptitude for Online Redistricting software.
1 https://www.ncsl.org/research/redistricting/redistricting-and-use-of-census-data.aspx, Accessed on June 14, 2021.
2 https://ssds.stanford.edu/us-census-bureau-releases-voting-age-population-race-and-ethnicity-cvap-file,, Accessed on June 16, 2021.
3 Email from Christi Zamarripa, National Conference of State Legislatures, summarizing 2020 apportionment data.
4 https://www.ncsl.org/research/redistricting/redistricting-and-use-of-census-data.aspx
5 U.S. Constitution Amendment XIV, §1.
6 Bethune-Hill v. Virginia State Bd. Of Elections, 137 2. Ct. 788, 797 (2017).
7 https://www.justice.gov/crt/history-federal-voting-rights-laws, Retrieved July 30, 2020.
8 Tokaji, Daniel P. (2006). "The New Vote Denial: Where Election Reform Meets the Voting Rights Act". South Carolina Law Review. 57., pp. 691-692; https://ballotpedia.org/Public_Policy
9 https://www.theatlantic.com/politics/archive/2021/09/it-time-rethink-hyper-minority-districts/620118/, accessed on September 21, 2021; https://www.wsj.com/articles/black-lawmakers-now-winning-in-white-communities-call-for-end-to-packing-black-voters-in-house-districts-11631106001, accessed on September 21, 2021.
10 https://www.niskanencenter.org/episode-6-multi-racial-electoral-coalitions-minority-candidates/
11 https://chicagounbound.uchicago.edu/cgi/viewcontent.cgi?article=1326&context=uclf, p. 368, accessed October 10, 2021.
12 National Conference of State Legislatures, Redistricting Law 2020, October 2019, Chapter 4, p. 77.
13 https://www.brennancenter.org/our-work/analysis-opinion/7-things-know-about-redistricting
14 National Conference of State Legislatures, Redistricting Law 2020, October 2019, Chapter 4, p. 79.
15 https://www.smithsonianmag.com/history/where-did-term-gerrymander-come-180964118/, Accessed on April 27, 2021.
16 https://www.smithsonianmag.com/history/where-did-term-gerrymander-come-180964118/, Accessed on April 27, 2021.
17 National Conference of State Legislatures, Redistricting Law 2020, October 2019, Chapter 9.