
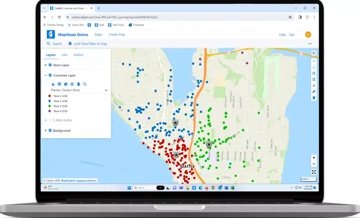
Heat Map Tool
Plot the density of your locations or any numeric data column as a smooth color-gradient heat map. Analyze sales concentration, customer density, or coverage gaps across any geography.
Every tool your team needs.
Built in. No add-ons.
Maptitude Online includes more than 70 mapping tools, analysis types, and platform capabilities, all built in, all included at one fixed price. The toolset includes concentric drive-time rings around every location at once, territory building that tracks how balanced each territory is in real time, catchment area maps that show which customers naturally belong to which location, and heat maps weighted by revenue or any other value. These are capabilities typically found in professional desktop GIS software. Here they work in any browser, and none requires a technical background.
30-Day Free Trial View Pricing
MAPPING TOOLS
The tools below include capabilities that are rarely available together in a single cloud mapping platform. Concentric drive-time rings around every location in your dataset at once. Territory tracking that shows how far each territory deviates from its target as you build it. Catchment area maps that assign each area to its nearest location automatically. Heat maps weighted by sales volume or any numeric field. Each one is a step-by-step wizard with no technical background required. Every tool is included at a fixed $795/year, no add-ons, no usage caps, no per-use charges.
Plot the density of your locations or any numeric data column as a smooth color-gradient heat map. Analyze sales concentration, customer density, or coverage gaps across any geography.
Scale radius circles around markers proportionally to any numeric value, revenue, headcount, units sold. See relative magnitude across all locations simultaneously.
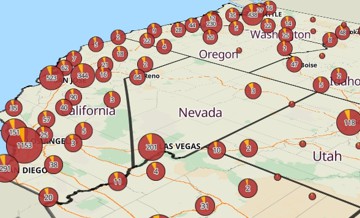
Group dense marker areas into clusters that show the number of locations contained within each cluster, then drill down by zooming in. Cluster maps keep high-volume maps readable without hiding individual locations from view.
Display bar charts at each location driven by your data columns, comparing sales by product line, population by age band, or any multi-value breakdown by geography. Each bar is sized proportionally and color-coded automatically.
Standard heat maps show where locations are densely concentrated. Maptitude Online goes further: weight heat map intensity by any numeric data field. A heat map weighted by sales revenue shows where your revenue is concentrated, not just where your customers are. A heat map weighted by claims shows high-cost areas, not just high-volume areas. This distinction changes the analytical value of the tool entirely.
When markers are densely packed, Maptitude Online can group them into clusters that display as pie charts, showing the categorical breakdown of every location inside the cluster, not just a count. Zoom in to see individual markers; zoom out and clusters automatically form with their charts intact. This combines density management with categorical analytics in a single theme.
Display the categorical breakdown at each location using pie chart markers, product mix, customer type, segment distribution, with each slice sized to your data.
Color-code any map layer by any data column, customer tier, region, revenue range, or demographic variable. Choose graduated, quantile, or custom color schemes with automatic legend generation.
Use one data column to control marker color and another to control marker size simultaneously. Communicate two dimensions of your data in a single visual without any coding.
Filter mapped data dynamically by any column, categories, numeric ranges, text values. Filters apply instantly across both map and tabular data views simultaneously.
Generate concentric drive-time rings (isochrones) in a single step, for example, 2, 4, and 6 minutes, around your entire point layer simultaneously. Set the number of rings and the interval once; Maptitude Online calculates all rings across all origins at once. Choose merged or separate rings for multiple locations, and get demographics calculated per individual ring or cumulatively. Supports time or distance units (minutes, miles, or kilometers) up to 10 hours. No per-ring charges.
Draw straight-line radius circles around any location. See exactly which of your mapped locations fall within the selected distance and export the filtered list to Excel.
Build territories interactively by clicking areas on the map, ZIP Codes, counties, Census tracts, or states, or import territory assignments directly from an Excel or CSV file. Unlimited territory creation included*.
Choose one or more fields to track as you build territories, population, households, revenue, and set a target value for each. Maptitude Online sums each field per territory in real time and shows how much each territory deviates from the target, so you can build balanced territories from scratch.
When building territories, choose exactly how area assignment works: Empty Areas only (only select unassigned areas), Any Area & prevent overlapping (reassign areas away from their current territory), or Any Area & allow overlapping (a single area can simultaneously belong to multiple territories). Deliberate overlap support is critical for franchise management, dual-rep coverage, and multi-channel territory strategies where exclusive zones aren't always the right model.
Create a territory layer directly from an Excel or CSV file containing existing territory assignments. Map the geography field and the territory name field, and Maptitude Online builds the territory map instantly, no manual clicking required.
Draw a freehand shape around any set of map features to select them for territory assignment. Any feature at least partially within the lasso is captured. Combine with the Brush, Circle, and Rectangle selection tools for precise territory building.
Optimize routes with up to 100 stops per route, more than most competing platforms. Get the most efficient driving sequence automatically, with turn-by-turn directions. Unlimited routes included*, no per-route charges.
Overlay 900+ Census and ACS demographic variables at the ZIP Code, Census Tract, County, State, or Census Place level, and critically, those 900+ variables are available per layer, not shared across levels. You can simultaneously display county income, ZIP code income, and Census tract income on the same map. Included data goes beyond Census/ACS: population projections (future planning), healthcare data (uninsured rates, coverage), GDP data (economic analysis), and ZIP Code business patterns (B2B market sizing). All fully included, no add-ons.
Query all 900+ built-in demographic variables in plain English. Type "ZIP Codes where median household income exceeds $75,000" or "Census tracts with the highest uninsured rates in Texas", Maptitude Online maps results instantly. Results can be mapped directly, downloaded as CSV, or exported as Excel. Query history is saved automatically and past queries can be rerun without counting against your monthly quota, so repeating the same analytical workflow costs nothing.
Draw lines, circles, rectangles, and polygons directly on any map. Dimensions display automatically as you draw. Click any drawn area to see estimated demographic data for the population inside it using the Info pane.
Measure the straight-line distance between two or more points. Drawn lines accumulate total distance as you add segments, with units switchable between miles, kilometers, and more.
Create distance rings around any set of point features, for example, 1, 2, and 3 miles, with population automatically calculated inside each buffer. Choose fixed sizes (up to three values) or evenly spaced intervals. When buffering multiple locations, choose merged buffers (compare the population within 0–2 miles vs. 2–4 miles across all stores) or separate buffers (compare the population around each individual store). Run on all features or a filtered selection.
Generate catchment area polygons around a set of points such that every location in each polygon is closer to its origin than to any other origin. Instantly visualize which customers, neighborhoods, or areas naturally belong to each store, office, or facility. Optional population calculation shows how many people fall within each catchment area.
Find the geographic or data-weighted center of any set of point locations. Choose no weighting (pure geographic center), coordinate averaging, or weight by any data field such as sales or population. Maptitude Online draws a circle encompassing all locations and marks the weighted centroid, useful for finding an optimal single facility location relative to your customers or employees.
Build complex multi-field queries using a visual filter builder, combine any number of conditions across different fields with operators such as greater than, equals, or contains. For example: customers in Needham or Needham Heights with sales of at least $2,000. Save up to three named selection sets and use them to run analysis or export just the filtered subset to Excel.
Convert addresses, postal codes, cities, or place names into map locations. Unlimited geocoding* is included at no extra cost. Your data is processed entirely within the Maptitude infrastructure, never sent to third-party geocoding APIs.
Multiple users can edit the same map or territory simultaneously. Changes merge automatically; each collaborator receives a notification confirming updates. Included in every subscription, no additional setup or tier required.
Search for any address, city, postal code, or landmark from within the map. The map zooms to the location instantly. Use it to build store locator maps or navigate quickly to any point of interest in your data.
Upload an Excel or CSV file and map it instantly using the step-by-step Create-a-Map Wizard. Select your location field, choose a map style, and your data is plotted and ready to share, no GIS knowledge, no configuration, no waiting. The same wizard-based approach applies to territory creation, drive-time analysis, and route optimization throughout the platform.
Take a flat spreadsheet of records and aggregate it by ZIP code, county, state, or Census tract, then display the result as a thematic area map showing total sales per territory, customer count per state, or any other summary statistic per region. This transforms point data into area intelligence without any GIS work. Choose a boundary layer, map your key field, and the aggregation is automatic.
MAPPING FEATURES
The features below include cartographic controls that are uncommon in browser-based mapping tools. Choose how your data is divided into color ranges: by equal intervals, by natural groupings in the data, or by equal population counts per group. Add symbol themes, pie and bar chart themes, pie chart clusters, combined color-and-size themes, and custom branding on shared maps. All in a browser. None requires a technical background.
Customize marker color, icon, size, and opacity for point layers. Control line color, dash style, and width. For area layers, set boundary and fill independently. Every visual element on every layer is adjustable.
Maptitude Online handles datasets of any size using WebGL rendering, from a handful of locations to 200,000 point locations per mapa, with no clustering or aggregation required and minimal performance degradation.
256-bit SSL encryption on all data in transit. Geocoding, routing, and mapping run entirely on Caliper-managed infrastructure with no third-party API dependencies, your location data never leaves Caliper's environment. Suitable for healthcare, government, and financial organizations.
Share maps publicly via stable URL, privately with specific users, or organization-wide. Embed any map on a website with a single iframe line. Export and print map and legend images. No limit on maps shared†. If the 100,000 map loads/month is exceeded, publicly shared maps continue to run without interruption, there is no hard shutoff‡.
Configure precisely how a map appears when shared, set the initial zoom level, visible layers, and legend display. Share a presentation-ready view that always opens exactly as intended for your audience.
Switch between a detailed standard street map and satellite imagery at any time. Control the visibility of individual map layers, street labels, and boundary overlays independently on either background style.
View complete turn-by-turn directions for any optimized route directly within Maptitude Online. Route plans with the full stop sequence and driving instructions are generated automatically as part of route optimization.
Upload your own BMP, ICO, JPG, PNG, or SVG files to use as custom map markers. Control icon color, size, and opacity independently. Brand maps with company logos, store photos, or any custom icon.
Navigate to any location using pan and zoom controls. Use Full Screen mode to maximize the map canvas. Zoom to show all features in any layer in a single click.
Switch to satellite imagery to view real-world terrain alongside your data, useful for site selection, logistics planning, and client presentations where physical geography adds important context.
Show or hide layers, labels, or themes independently. Rename layers and remove them at any time. Add demographic layers, territory layers, and custom data layers to the same map simultaneously.
Control exactly what shared map viewers can see and do. Organization administrators can manage user permissions, restrict who can publish maps, unpublish maps organization-wide, and transfer maps between users, all from the admin dashboard.
Display and interact with the full data table for any layer alongside the map. Filter records in the table and see matching locations highlighted on the map. Download any table directly to Excel with one click.
Click any feature on the map to display its full data record in the Info pane. Switch between layers at the same location to inspect data from each. Download any feature's data to Excel directly from the Info pane.
Display a dynamic legend showing all values, colors, and themes on any map. Export the legend as a standalone PNG image for use in reports and presentations alongside exported map images.
Download the full territory assignment table, which geographic areas belong to which territory, as an Excel file at any time. Use exports to feed CRM systems, reporting tools, or upstream planning workflows.
A single map can contain more than one territory layer simultaneously, for example, sales territories and service zones overlaid together. The Territory Manager lets you switch between layers and edit each independently.
When territories have unassigned holes, areas missed during interactive editing or missing from an imported table, the Fill tool automatically assigns those areas to the surrounding territory, keeping every part of the map covered.
Attach PDF reports to any map when you upload them from desktop Maptitude. Viewers can scroll, print, and download attached reports directly in Maptitude Online, no separate PDF application required.
Each area layer uploaded from desktop Maptitude supports up to 25,000 custom polygon features, far beyond the limits of most cloud mapping tools, which restrict you to pre-built boundaries or a small number of hand-drawn shapes. Build detailed custom regions, sales zones, or service areas at a scale most tools can't match.
When you update a shared map, the original URL stays valid. Recipients always see the latest version without needing a new link, no re-sharing, no broken bookmarks. Maps can also be transferred between users, and administrators can unpublish maps organization-wide at any time.
Export your map as a PNG image for offline sharing, printing, and presentations. Export the legend separately as a PNG image. All exports are available directly from the Options menu, no third-party tools required.
Maptitude Online has an AI support assistant available at any time, no wait, no support ticket, no GIS knowledge required. Ask how to perform any task in plain English and get a structured, step-by-step answer instantly, day or night.
Coming in 2026: see exactly how your public maps are performing. The Analytics tab in your account dashboard will automatically track views for every public map and display a ranked list of your top 10 most interacted with maps, no third-party setup, no tracking code required.
Coming in 2026: map Google Sheets data directly alongside Excel and CSV files. Connect your Google Sheets and create maps from spreadsheet data without exporting or converting files first.
Coming in 2026: map Salesforce records directly from Accounts, Contacts, Leads, and Opportunities. Connect your Salesforce org and visualize CRM data on a map alongside your Excel, CSV, and Google Sheets files, no manual export required.
Assign a distinct symbol, not just a color, to each class of values in a data field. Ideal for categorical data where shape communicates meaning: show different symbols for each sales territory, product type, or customer segment on the same map. Choose symbols per class from the full Maptitude Online symbol library.
Apply a color theme driven by one data field and a size theme driven by a second data field simultaneously on the same layer. For example, color markers by customer tier and scale their size by revenue, communicating two independent data dimensions in a single visual without any additional layers.
Choose how data is divided into color classes: Equal Size Intervals, Natural Breaks (Jenks, minimizes within-group variance using the Fisher-Jenks algorithm), Quantiles (equal feature counts per class), or Standard Deviation (classes above and below the mean). Choose Sequential, Diverging, or Qualitative color palettes. Select the number of classes and set custom colors for undefined values. This is professional GIS-grade cartographic control in a no-code interface.
Set your own logo, site title, and click-through link URL on all publicly shared maps. Shared maps appear under your brand, not Caliper's, making them suitable for client-facing deliverables, embedded maps on company websites, or white-label use. Configure once in account settings; all public maps inherit the branding automatically.
Choose between two URL sharing modes when publishing a map. Unlisted maps are accessible to anyone with the link but not indexed by search engines, ideal for sharing with clients without broad public exposure. Public maps are fully indexable and discoverable via search. Switch between modes at any time without changing the URL. For a custom-domain map, embed the iframe as the sole content of any webpage at any URL you choose, your map appears to live at your own domain with no additional infrastructure.
Collaborate with team members by sharing feedback and comments directly within a map. Coming in 2026: built-in messaging lets collaborators annotate and respond to map content without leaving Maptitude Online.
WHY MAPTITUDE ONLINE
The advantages below are verifiable. Every claim links to documented feature behavior, a measured specification, or a verified third-party rating. Maptitude Online is rated 5/5 on G2 and Maptitude is placed in the top 0.63% of all software vendors in G2's 2026 Best Software Awards. On G2's independently measured dimensions, Maptitude scores 9.5/10 for data manipulation and 10.0/10 for data storage.
Most cloud mapping tools charge separately for demographic data or provide only a thin Census layer. Maptitude Online includes 900+ demographic, ACS, and Census variables at five geography levels in every subscription. No API calls, no credits, no add-ons.
$795/year covers everything: unlimited* geocoding, territories, drive-time rings, routes, and maps. No one-time license fee, no charge per territory, no separate support contract, and no charges for new features as they are released. Every platform update, including the three major features arriving in 2026, is included automatically. Competitors charge per geocode, per route, or per API call. Maptitude Online never does.
Geocoding, territory creation, drive-time rings, route optimization, and maps are all unlimited within the 20GB storage included per account. No monthly caps, no tiers to unlock usage.
All data is encrypted with 256-bit SSL. Because geocoding, routing, and mapping run entirely on Caliper-managed infrastructure, your location data never passes through third-party services, critical for healthcare, government, and financial organizations.
Every component, geocoding, routing, map tiles, and demographic data, is native to the platform. No external API dependencies means no third-party outages, no per-call charges, and no data leaving the Maptitude environment.
Fully functional on any smartphone or tablet in a modern browser, iOS or Android. The mobile interface includes the complete toolset: data tables, geocoding, analysis tools, selection, and navigation. No app download required.
Runs entirely in a web browser on Windows, macOS, iOS, or Android. Nothing to install, no IT involvement, no version updates to manage. Operational from the moment you sign up.
Every feature, geocoding, territory creation, drive-time analysis, route optimization, demographic mapping, is accessible through step-by-step wizard-based workflows. No scripting, no GIS training, no technical staff needed.
Built by Caliper Corporation, a GIS software company founded in 1983. Maptitude Online is rated 5/5 on G2, and Maptitude is named a Top Software Product in G2's 2026 Best Software Awards, placing in the top 0.63% of all vendors. Rated 92% for Quality of Support and 93% for Ease of Doing Business. Phone and email support plus an AI support assistant available at any time.
Maptitude Online supports mapping for locations worldwide, not just the United States. Global search is available across the platform for international business teams, with street maps provided for the USA, Canada, UK, Europe, Australia, and New Zealand.
Manage users and teams from a central admin dashboard. Control who can publish maps, transfer maps between users, unpublish maps organization-wide, and restrict future publishing, without IT involvement.
Teams with a desktop Maptitude license can upload any map, territory, drive-time, or route maps, directly to Maptitude Online and share via a stable URL with anyone. No third-party tools, no file exports, no extra steps.
Two user tiers, Basic and Administrative, with clearly separated permissions. Admins create and manage teams, add or remove users, block individual accounts, and control who can publish maps. Share maps with entire named teams in one step, not just individual users. When a user is deleted, their maps are automatically transferred to another user rather than lost. A structured, enterprise-grade access model built into every subscription.
The free trial includes full, unrestricted access to every feature with no waiting period. Account storage and map loads are identical to a paid subscription. Convert to a paid annual subscription at $795 at the end of 30 days.
* Unlimited up to 20GB storage per account.
† All public and private map loads count toward a combined 100,000 map loads per month. If that figure is exceeded, shared maps continue to run without interruption.
‡ Map access for inactive subscriptions or in excess of monthly allowances is provided at Caliper Corporation's discretion.
a For maximum responsiveness, cluster themes are recommended, especially for single layers that approach the maximum features per map (e.g., a single layer of 200,000 locations)
Full access from day one. No credit card required. Any device, any browser.
$795/year after trial • Fixed price, no usage fees • Supported by Caliper Corporation since 1983

Home | Products | Contact | Secure Store