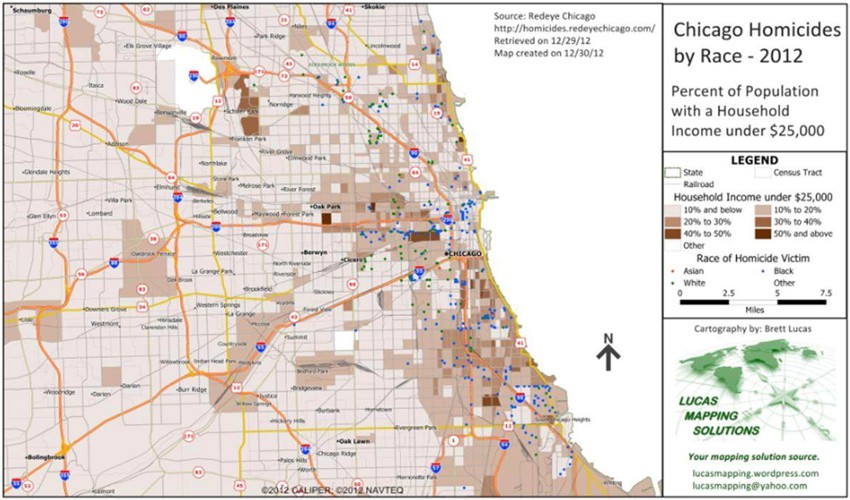
This map shows the locations of all of the homicides in Chicago during 2012, broken down by race, overlaid with data showing the percentage of households with a household income less than $25,000 per year.
See more map infographics Learn more about Maptitude
Map: Created by Lucas Mapping Solutions with Maptitude Mapping Software by Caliper, Ocotober 2013
Home | Products | Contact | Secure Store
