For more than 40 years, Caliper software, data analytics, and professional services have been making business and government more effective and efficient. Our award-winning and market-leading mapping and transportation software provide unequaled analytic capabilities while being easy to use and low-cost solutions accessible to all types of organizations. We build custom applications that further exploit the power of our software and build computer models that support management decisions and business operations. The consulting studies conducted by our nationally recognized experts have successfully underpinned major capital investments and have advanced the analytical methods available for application.
TransCAD is the world’s most capable software for transportation planning. TransCAD is a comprehensive package for modeling passenger and freight transportation. It is a platform for multimodal analysis and works at all geographic scales from real estate parcels to global flows. TransCAD includes all the tools and analytical procedures to support all types and styles of transportation demand models ranging from aggregate, macroscopic models to fully disaggregate activity-based and agent-based models. Other important applications include market analysis, logistics planning, routing and scheduling, network analysis, and facility location.
TransCAD is used in more than 90 countries and is the most widely used software for forecasting in the United States. TransCAD is the platform for the travel demand models adopted by more than 70% of metropolitan regional planning agencies in the United States who do modeling. More than 40 State DOTs have TransCAD licenses, and TransCAD has been used for national freight models by U.S. DOT Federal Highway Administration and Federal Railroad Administration. Around the world, TransCAD is used for numerous national and world city models.
TransCAD has broad and deep modeling capabilities focused on:

TransCAD is the most comprehensive, flexible, and capable transportation modeling software ever created. TransCAD features a unique, modern software architecture designed to support the highest quality and highest performance solutions to the analytical needs of transportation organizations. At the core of the software's architecture is an object-oriented, geo-relational structure with comprehensive, logical and intuitive support for a full range of transportation data objects important for realistic transportation analytics.
Networks, routes, travel paths, trajectories, flow and travel time/distance matrices, isochrones, territories, traffic analysis zones are among the key native objects in TransCAD. These objects and their constituent components are flexibly geo-referenced and relationally linked to data attribute tables. Interactive and programmatic editing of these data types are both supported with unequaled ease of use.

The built-in relational database has the high capacity needed for the largest modeling datasets and is extremely facile in geographic search. Key database operations can be performed with TransCAD that would otherwise require separate database software and its attendant overhead for file transfer. Designed from the outset to integrate full GIS integration, all data can be geo-referenced and incorporated in modeling. TransCAD is also integrated with other GIS software and maintains compatibility with Esri’s popular software.
TransCAD has no practical limits for the number of zones or network size and Caliper does not charge a premium for handling the largest problems.
Superior transportation algorithms and improved software engineering enable TransCAD to provide key advantages when compared to other planning software. The best methods from the transportation science literature are incorporated and periodically updated when new improvements can be obtained. TransCAD is also continuously improved to take advantage of the latest, affordable computer hardware. Key procedures in TransCAD are efficiently multi-threaded and parallel processing is also supported on one more computers on a local network or in the cloud.
Caliper has also led the way with providing an intuitive and capable user interface. From the outset, TransCAD has had an interactive user interface to all of its procedures. This facilitates learning TransCAD and also provides prototyping of model components with nearly immediate feedback, greatly reducing model development and testing time.
TransCAD software can be used by a wide range of professionals and using it does not require programming skills. However, TransCAD is completely programmable using the Caliper GISDK scripting language, Python, native COM-compliant languages such as C++, and any other .NET-enabled languages such as C# or C++/CLI.
In the latest version of TransCAD, Python is completely integrated as a supported programming language, providing seamless Python interoperability with the Caliper GISDK. Users can now harness the power of Python within the TransCAD platform. Python programs can be accessed directly from TransCAD, TransCAD can be called from Python, and with Python in-lined with TransCAD, a broad and comprehensive array of Python libraries and capabilities, including machine learning and AI packages, can be leveraged together with th unparalleled transportation analytics in TransCAD.
Caliper provides sample scripts for all types of transportation demand models and these can be readily modified and adapted by users for their own efforts. The GISDK includes more than 500 key macro functions that perform transportation model and GIS calculations. These functions include those needed to create custom user interfaces for applications and extending TransCAD with user-created software.
TransCAD also provides the best tools and user interfaces for model application. Model user interfaces are used to streamline model application to alternative future scenarios and reduce the burden on users to keep track of scenario inputs and outputs. They also make model structures and parameters more transparent and easily understood. A built-in and capable scenario manager reduces the burden on users in specifying alternatives and avoids unnecessary duplication of data files.
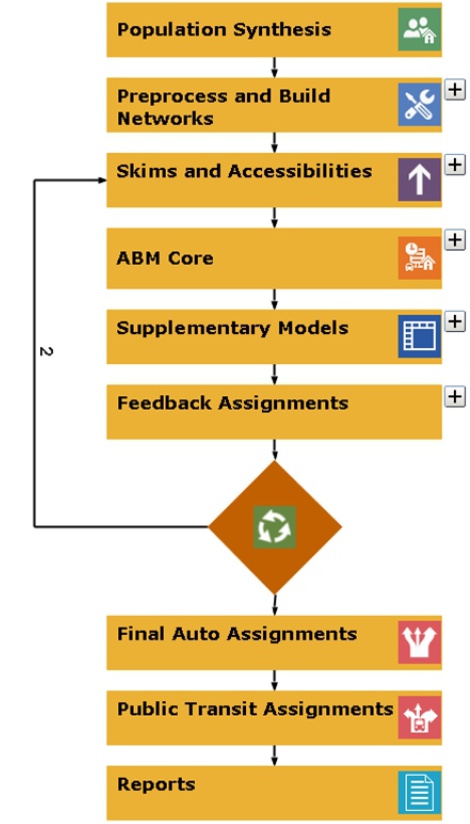
While TransCAD features several alternative user interfaces for completed models, the flowchart interface has been evolving as the preferred option. The flowchart interface is effectively an API for models that simplifies both model development and model application by non-technical users. TransCAD has always outshone other software in providing clear, simple, and effective user interfaces to its functionality without requiring programming. The flowchart interface makes it easier to control model application and also to implement parallel processing. Tasks specified in the flowchart as parallel will be executed that way and use the appropriate computers. The flowchart UI makes it clear what the inputs and outputs are for each model step, provides one-click visualization of results, and makes it easy to add pre and post processing utilities and reports within a menu interface.
Travel forecasting models are used to predict changes in travel patterns and the utilization of the transportation system in response to changes in regional development, demographics, and transportation supply. Modeling travel demand is a challenging task, but one that is required for rational planning and evaluation of transportation systems.
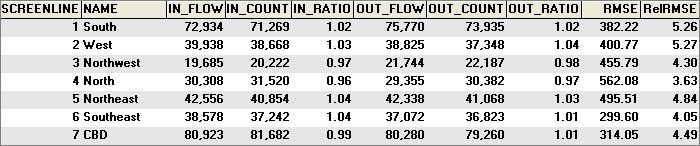
TransCAD is the only modeling package that is GIS-based and fully integrates geographic information system (GIS) and demand modeling capabilities. TransCAD is an extremely capable and robust GIS that includes many advanced features for transportation that are not available in other general-purpose GIS software products.
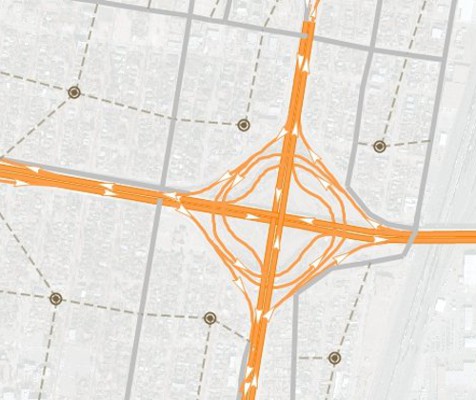
There are many reasons to have a GIS as part of a travel demand forecasting package. First, GIS makes it possible for planning models to be much more accurate. For example, network distances are based on the actual shape of the road network and a correct representation of high-way interchanges.
Second, the whole modeling process is more efficient. Data preparation is greatly facilitated and the database and visualization capabilities catch errors before they cause modeling problems. With TransCAD, you and others will have an easier time understanding how the model components behave, thus requiring less staff time to implement and maintain travel models.
A third important advantage of a GIS-based modeling system is the use of the GIS itself and GIS-derived measurements directly in the modeling process. In TransCAD, different modeling equations can easily be derived and applied for different geographic subareas. Similarly, TransCAD brings new and much-needed capabilities for measuring geographic accessibility.
Because they have similar architectures, TransCAD is the planning package that integrates best with other institutional GIS software systems. TransCAD has native support for Esri Geodatabases, Access, Excel, Oracle, SQL Server, and Google Earth. TransCAD can exchange data with virtually all major GIS, CAD, and planning software packages.
TransCAD is unique among travel demand forecasting packages in many respects:
TransCAD includes comprehensive tools for trip generation, trip distribution, mode split modeling, traffic assignment, and all related matrix and network processes. TransCAD includes all of the traditional 4-step models and significant variants, quick response models with reduced data requirements, and advanced disaggregate demand models. Caliper continually enhances TransCAD to incorporate the most up-to-date methods for demand forecasting.
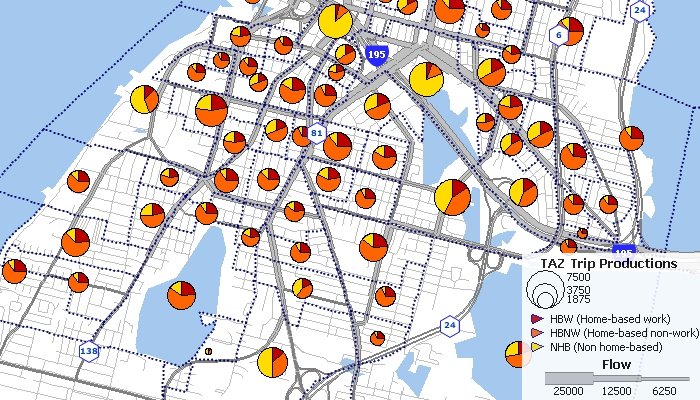
TransCAD includes a variety of trip generation models to forecast trip productions and attractions on any level of geographic aggregation. Among the methods are cross-classification, regression, and discrete choice models. TransCAD provides methods for the application and estimation of trip generation models. Also included is a powerful method to produce synthetic populations consistent with demographic distributions. The outputs of the population synthesis may be used as inputs to both traditional travel demand models as well as more advanced Activity-Based Models (ABM).
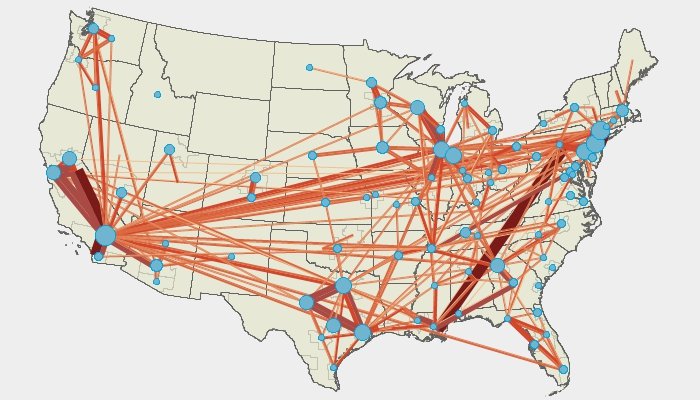
Trip distribution models are used to predict the spatial pattern of trips or other flows between origins and destinations. Models similar to those applied for trip distribution are often used to model commodity flows, retail trade, and store patronage.
TransCAD provides numerous tools with which to perform trip distribution, including procedures to implement growth factor methods, apply gravity models, generate friction factors, and calibrate new model parameters.
TransCAD includes tri-proportional models which allow for another dimension of constraints. In tri-proportional models, groups of cells in the P-A flow matrix are required to sum to specified values. TransCAD allows the additional dimension to be applied for both growth factor and gravity models.
In addition to traditional trip distribution methods, TransCAD supports modern distribution techniques based on discrete choice frameworks to apply destination choice models at both aggregate and disaggregate levels. Destination choice models include shadow pricing options to ensure consistency between productions and attractions.
Mode choice models are used to analyze and predict the choices that individuals or groups of individuals make in selecting the transportation modes that are used for particular types of trips. Typically, the goal is to predict the share or absolute number of trips made by mode.
An important objective in mode choice modeling is to predict the share of trips attracted to public transportation. TransCAD provides procedures for calibrating and applying mode choice models based on multinomial and nested logit models, as well as legacy methods, and may be pursued at either a disaggregate or aggregate zonal level.
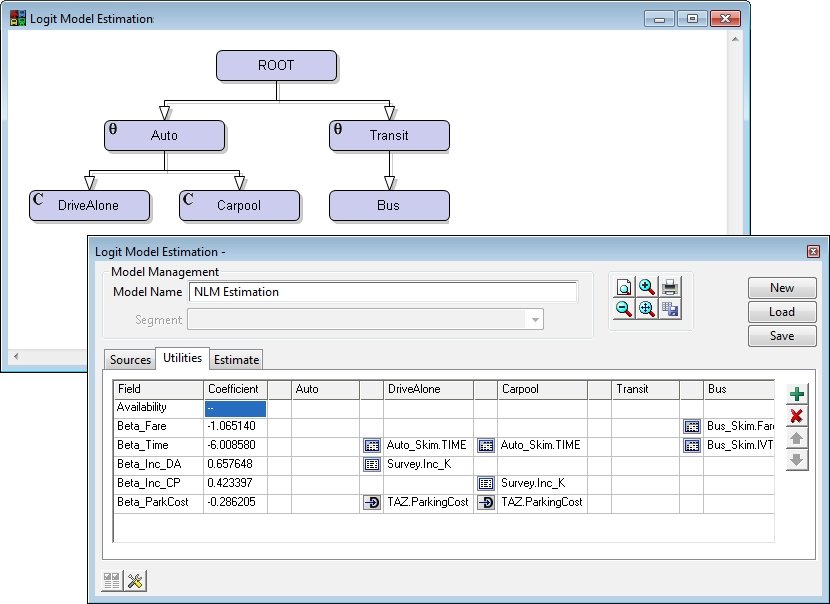
Estimation of the parameters in the nested logit and multinomial logit model is performed in TransCAD by the method of maximum likelihood, which calculates the set of parameters that are "most likely" to have resulted in the choices observed in the data. There is enormous convenience in estimating and applying nested logit models in the same software environment.
A special interface lets you draw the structure of your nested logit model graphically. A companion model management window helps setup the utility functions and data sources. With this interface, estimating nested logit models has never been easier.
TransCAD supports choice set variation in both estimation and model application which is important for accurate model specification. TransCAD also provides support for coding user-defined mode choice procedures in FORTRAN, C, JAVA, and C++.
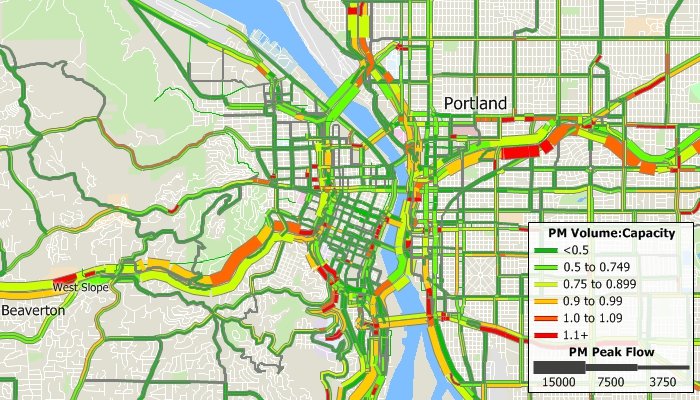
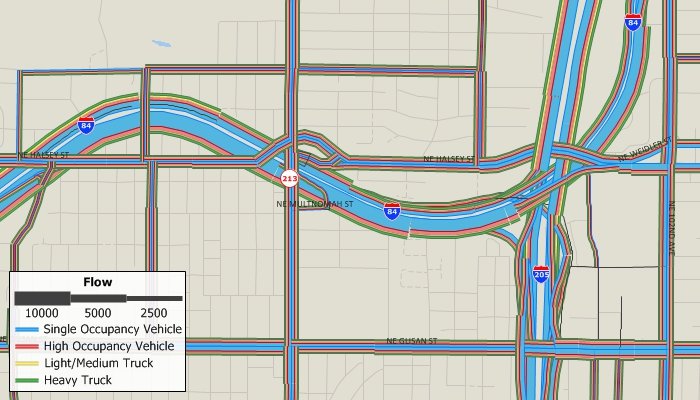
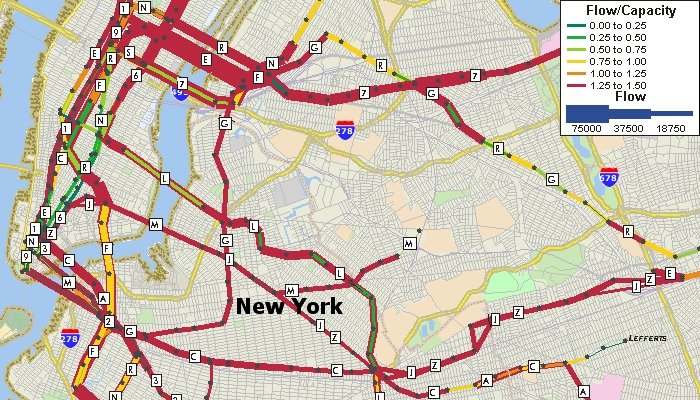
TransCAD incorporates several breakthroughs in traffic assignment methodology that facilitate more accurate analyses of road traffic and the impacts of transportation improvements. All of the user equilibrium methods can achieve very high levels of convergence and do so with unprecedented fast computing times. Also, all of the methods take advantage of multi-threading to run much faster on multi-core and multi-CPU computers.
Among the advanced methods is a very flexible, master multi-modal, multi-class equilibrium or stochastic equilibrium assignment model that accommodates realistic multi-class entrance-to-exit tolls in addition to traditional link tolls. This is a generalized cost assignment that uses class specific values of time and network use restrictions. A wide array of volume-delay functions has been pre-programmed and there is provision for user written functions as well.
TransCAD includes several modules for performing intersection LOS calculations and calculating related HCM measures. These are very convenient to use as no data transfer is required.
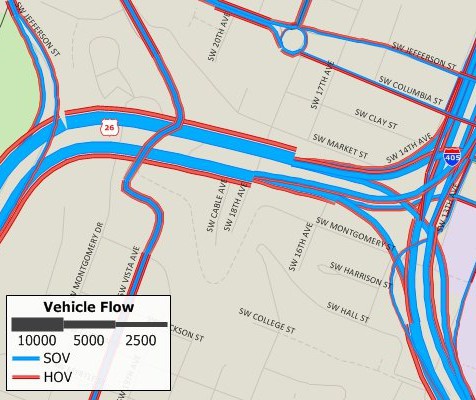
Screenline Analysis: Screenline analysis compares trip assignment results with the traffic counts on roads. More precisely, it is a process of comparing the directional sum of ground count traffic volumes across a screenline or a cordon line with the directional sum of the assigned traffic volumes across the same screenline or cordon line. Screenline analysis is a useful tool for the calibration of trip assignment models, and it can also be used for more general purposes such as calculating flows that cross a screenline.
Subarea Focusing: While forecasting transportation demand for a region, you may be interested in performing a more detailed investigation of traffic patterns within a subarea, such as the downtown area. To facilitate subarea analysis, TransCAD provides a procedure that lets you create an O-D trip table for any subarea. The reduced O-D table may be used for performing a traffic assignment on a subarea network which may be more detailed than the regional network, or used in a traffic simulation for the subarea.
Assignment Differences: You can compare two flow tables to find assignment differences. The assignment differences utility creates a theme that graphically illustrates the locations and magnitudes of differences. This tool is particularly useful for analyzing the effects of changing network attributes, such as capacity or VDF parameters, or employing different assignment techniques.
Select Link/Zone Analysis: You can create an origin-destination matrix file that indicates the number of trips that pass through a specified set of links or zones, sometimes referred to as critical links or critical zones. You can also create an assignment table that contains the component of flow on links that pass through a specified set of links or zones.
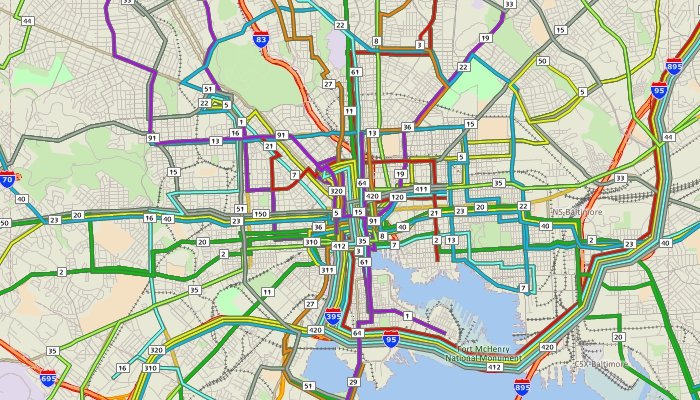
Public transit is a specialty of TransCAD, with capabilities that greatly exceed those of other planning packages. TransCAD is the only software that has a realistic GIS-based representation of transit systems. TransCAD has special data structures for handling transit routes in all their natural complexity. Routes may be stored, displayed, edited, and analyzed. An important feature is that transit routes can be directly placed on the streets so that interactions between autos and transit can be treated explicitly. Moreover, stops need not be located at street intersections, but instead can be located where they really are and on the correct side of the street. Special visualization capabilities for transit make it easy to display and label overlapping routes. TransCAD has the broadest set of transit pathfinding routines of any package and includes headway-based and schedule-based methods.
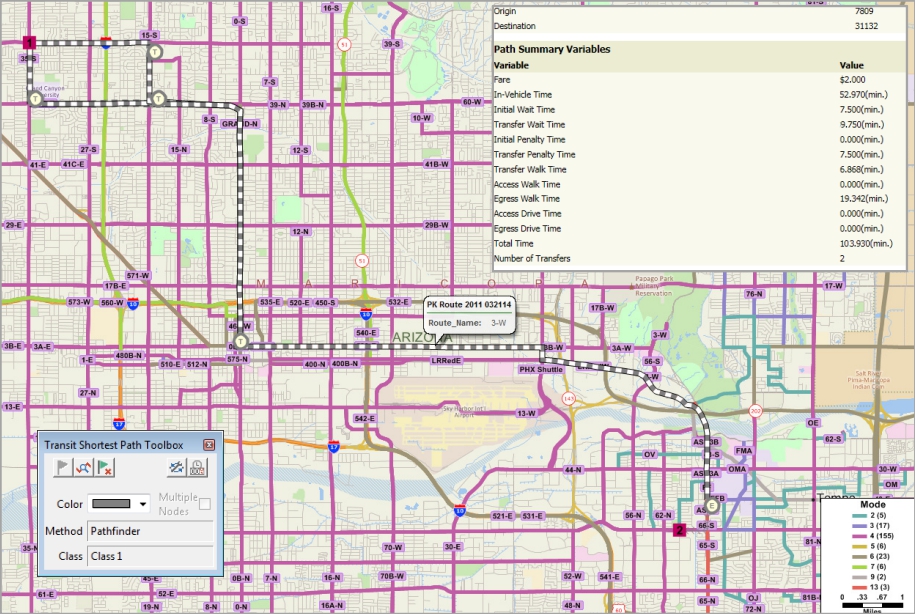
TransCAD has special tools and procedures for creating and working with transit networks. Transit fares can be specified as flat, zonal, or mixed. Using transit networks and fare structures, you can solve shortest path problems, calculate transit path attributes (i.e., skims), and perform transit assignment.
TransCAD can process schedules and assist in developing network attributes such as route headways.
TransCAD can perform transit analysis based on schedules including interactive schedule-based origin-to-destination paths, schedule-based transit skimming, and schedule-based transit assignment. Transit networks imported from GTFS will also import schedule data.
TransCAD includes the most realistic and flexible transit pathfinding and skimming methods. The key methods provide the multiple paths that travelers will use and give the analyst fine control over access, egress, and transfer properties.
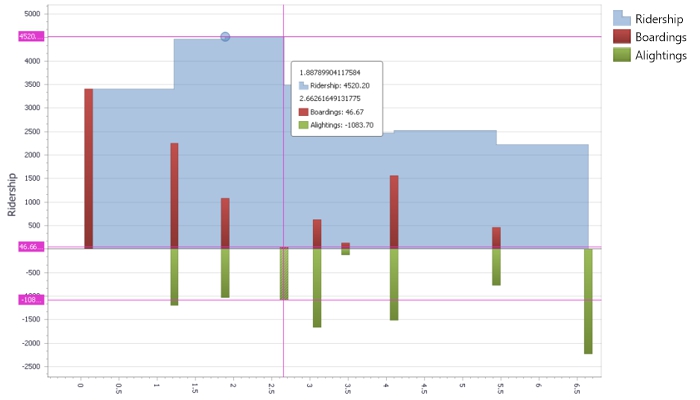
Transit assignment models are used to estimate the number of passengers that utilize segments in a transit network as a function of transit level of service. These models take as input a matrix of passenger flows between origins and destinations and a transit network, and produce link level and aggregate ridership statistics. TransCAD includes an array of sophisticated transit network assignment procedures.
These procedures include multi-class methods that are sensitive to fares, access station choice, and park and ride access, as well as equilibrium assignments, which take account of the capacity of transit service and the effect of ridership on crowding, comfort, and, optionally through dwell time effects, on the travel time on the route. These methods distribute the flow between a particular origin and destination to multiple paths, based on their relative attractiveness.
The transit assignment procedures produce a table of ridership at every stop along each route in the transit network. Optional outputs include critical link analysis, boarding and alighting counts, stop-to-stop flows, route-to-route transfers, and aggregate ridership counts. You can also save the paths utilized and visualize them directly.
With TransCAD, public transportation routes can easily be mapped using General Transit Specification Feed (GTFS) data. The data can be imported as TransCAD Routes System files directly or conflated to lie on top of a routable street file that can also be used for calculating walk, drive, and bicycle access and egress. These routes can then be used for advanced public transportation modelling and public transportation accessibility.
TransCAD offers native support for custom-built Activity-Based Models (ABM). It features a highly efficient computational platform synthesizing the advantages of multithreading and parallel processing to tackle the large populations and heavy numerical calculations associated with the most sophisticated ABMs in practice. Both traditional and state-of-the-art econometric modeling frameworks are available to the modeler, including linear regression, multinomial and nested Logit, destination choice, hazard duration and Multiple Discrete-Continuous Extreme Value (MDCEV) procedures. An easy-to-use flowchart interface allows model components to be organized and interconnected to represent the desired behavioral processes. A flexible parameter editor facilitates specification and editing of model structures, utility equations and data sources, also allowing the user to define expressions to create new variables on the fly from existing matrices and tables. All of the ABM features are integrated with the other TransCAD procedures and tools including multi-modal traffic assignment, GIS-based data visualization, and reporting. The outputs from TransCAD ABMs can also be used directly as inputs to simulation-based Dynamic Traffic Assignment (DTA) in TransModeler.
Accurate and up-to-date trip tables are critical inputs for transportation planning models. Traditionally, the principal method of collecting information on the spatial pattern of trips within urban areas has been the large scale home interview survey. Unfortunately, home interview surveys of the necessary sample size are prohibitively expensive and difficult to implement, and are therefore rarely done. In contrast, traffic counts on highway links are inexpensive to perform and are routinely collected in many areas. It is thus extremely attractive to have a method to create or update trip tables based upon traffic counts.
TransCAD provides very flexible and effective procedures for estimating and/or updating an origin-destination matrix based upon a sample of network link traffic counts and an initial or base trip table.
With TransCAD you can have separate and fully integrated networks for bicycles and pedestrians. Pedestrian links can be full street networks. Walk links can be included in transit networks.
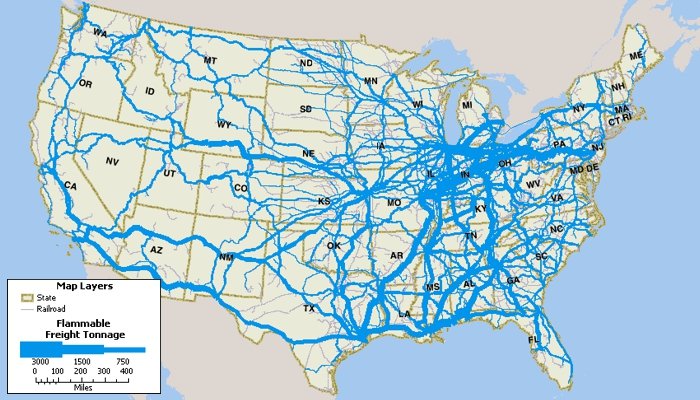
TransCAD has been designed to facilitate freight demand modeling as well as passenger models. TransCAD can manage all of your freight data no matter how many origins, destinations, shipments, or commodities are involved. TransCAD offers a complete solution for modeling commodity flows and truck movements. Freight traffic can be easily assigned to the transportation network and there are also specialized assignment procedures available for rail waybill assignment.
TransCAD includes utilities that model developers will find indispensable for data preparation.
TransCAD provides great flexibility in building complete model applications, with attractive user interfaces that are easy to learn and use. Models can be compiled and published or distributed to third parties with their key properties locked down to protect inappropriate modifications. TransCAD comes with its own scripting language, GISDK™, the GIS Developer’s Kit. GISDK is a simple object-oriented scripting language that provides hundreds of powerful modeling and GIS functions. GISDK includes a compiler and a debugger and provides all the tools needed to create model scripts. TransCAD can also be scripted with Python and called from any .NET language.
The TransCAD Model Manager is a graphical environment for building integrated travel demand planning models and running scenarios. The Model Manager allows you to create, understand, and edit planning models based on a flowchart interface. It also provides a wide variety of advanced scenario management tools.
With the model manager, you can interactively specify the order of the modeling steps to be performed, select all of the input and output files, and edit the model procedure parameters. The easy-to-use interface also documents the model and its components, and makes it simple to set up parallel processing.
The model manager includes a powerful scenario management facility. Once you have a working model, you use the Scenario Toolbox to organize the parameters for different runs of the model and to run the scenario. The Scenario Toolbox is the control panel for creating new scenarios, for editing and reviewing their parameters (input and output data files), and for running the model under different scenarios.
Object-oriented methods are used to maintain the relationships among sets of interrelated scenarios. Each scenario allows users to define the base directory that the model files use and, optionally, all the relevant input and output file names and parameters for the scenario. Additionally, sub or "child" scenarios can be created that are a subset of another scenario. The child scenario by default inherits all parameter values from its parent. Whenever the parent scenario’s parameters change, the child's values change automatically, greatly streamlining the model process. Innovative
There is an innovative batch processing system that is built in to TransCAD. TransCAD lets you create scripts interactively by clicking menu items, choosing parameters in dialog boxes, and saving the corresponding script.
TransCAD will perform well on any 64-bit computer than runs Windows 11. Recommended hardware includes at least 16GB of RAM and 100GB of disk space. For large models, additional memory and disk space may be required. More detailed hardware recommendations are available upon request from Caliper.
Email sales@caliper.com or call us at +1 617-527-4700 to learn more.
TransCAD uses Intel® Math Kernel Library
Home | Products | Contact | Secure Store