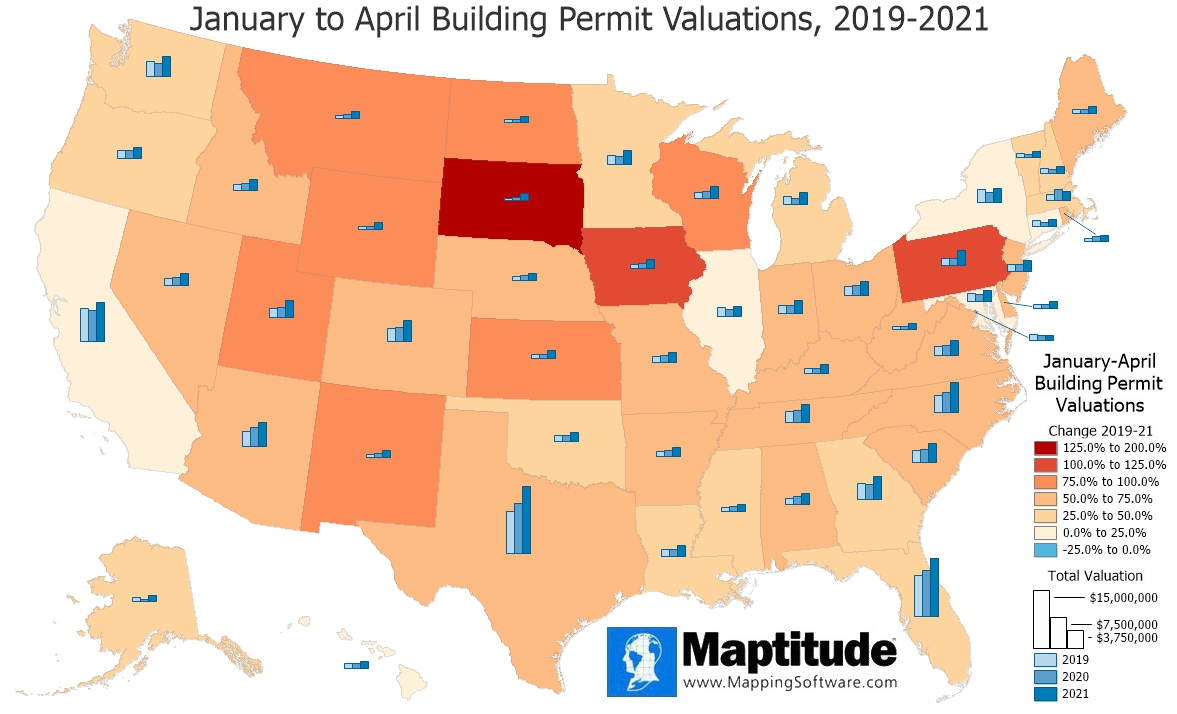
Maptitude is the best mapping software for business intelligence! This month's featured map compares the January-April building permit valuations for 2019-2021. Building permit valuations are up from 2019 levels in every state, though down in the District of Columbia (-6.1%). The color theme shows that 31 states had building permit valuations go up at least 50% this year compared to 2019, and they more than doubled in South Dakota (177.9%), Iowa (107.7%), and Pennsylvania (101.9%).
The charts show that 19 states saw a decline in the first four months of 2020 as compared to 2019. Massachusetts saw the largest increase in 2020 despite two months of pandemic and was the only state to see a decline in building permit valuations from 2020 to 2021.
If you need a custom map for your story, blog, or website, contact us because we offer a limited number of free custom maps on a first-come, first-served basis! See our Featured Maps for inspiration.
Map: Created with Maptitude Mapping Software by
Caliper, June 2021
Source: Census Bureau Building Permits Survey
#Maptitude #BuildingPermits
Home | Products | Contact | Secure Store
