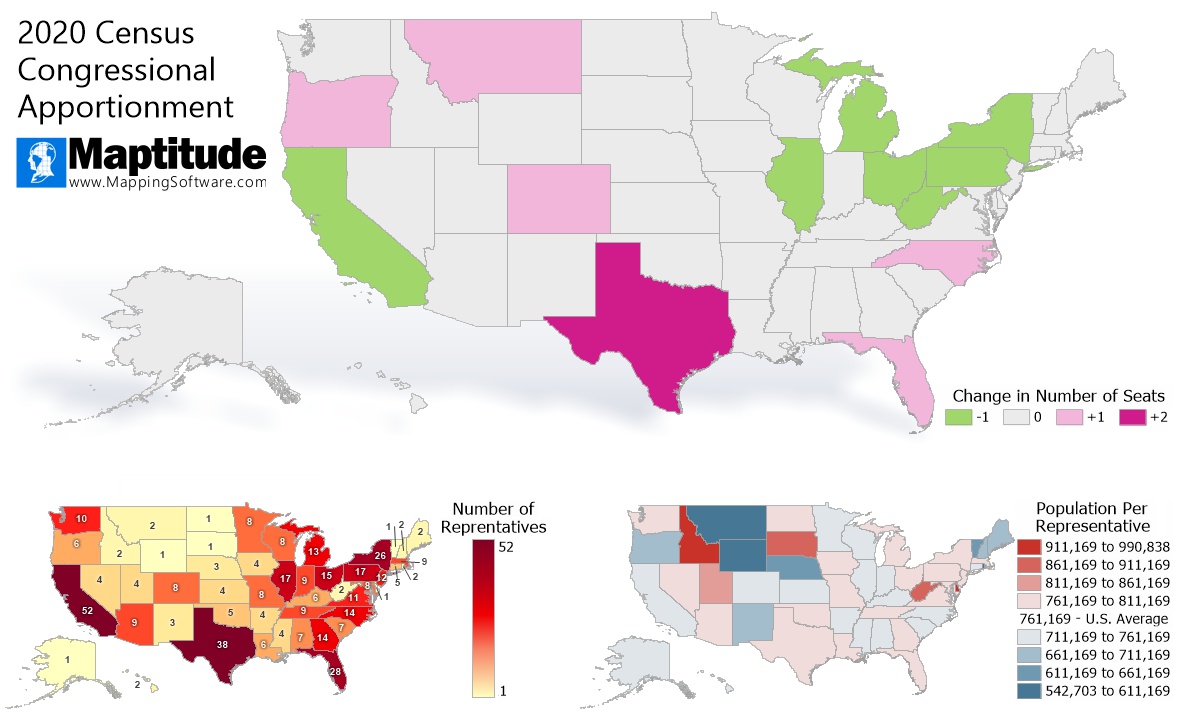
Maptitude is the best mapping software for business intelligence! The Census aims to count everyone in the USA every ten years. These demographic figures are used to assess the number of House of Representative seats each state receives, in addition to recognizing the evolving population structure of the United States and local funding. The maps below show the changes in apportionment based on the 2020 Census. Seven states will lose a Congressional seat, five states will gain a seat, and Texas will gain two seats.
Map: Created with Maptitude Mapping Software by Caliper, May 2021
#Maptitude #Census #2020 #Redistricting #Reapportionment
Home | Products | Contact | Secure Store
