Maptitude is the best mapping software for business intelligence! This month's featured map showcases new lifestyle data for Maptitude 2018. Data on happiness, health, and habits are included for the following layers: State, County, Census Tract, and ZIP Code.
If you need a custom map for your story, blog, or website, contact us because we offer a limited number of free custom maps on a first-come, first-served basis! See our Featured Maps for inspiration.
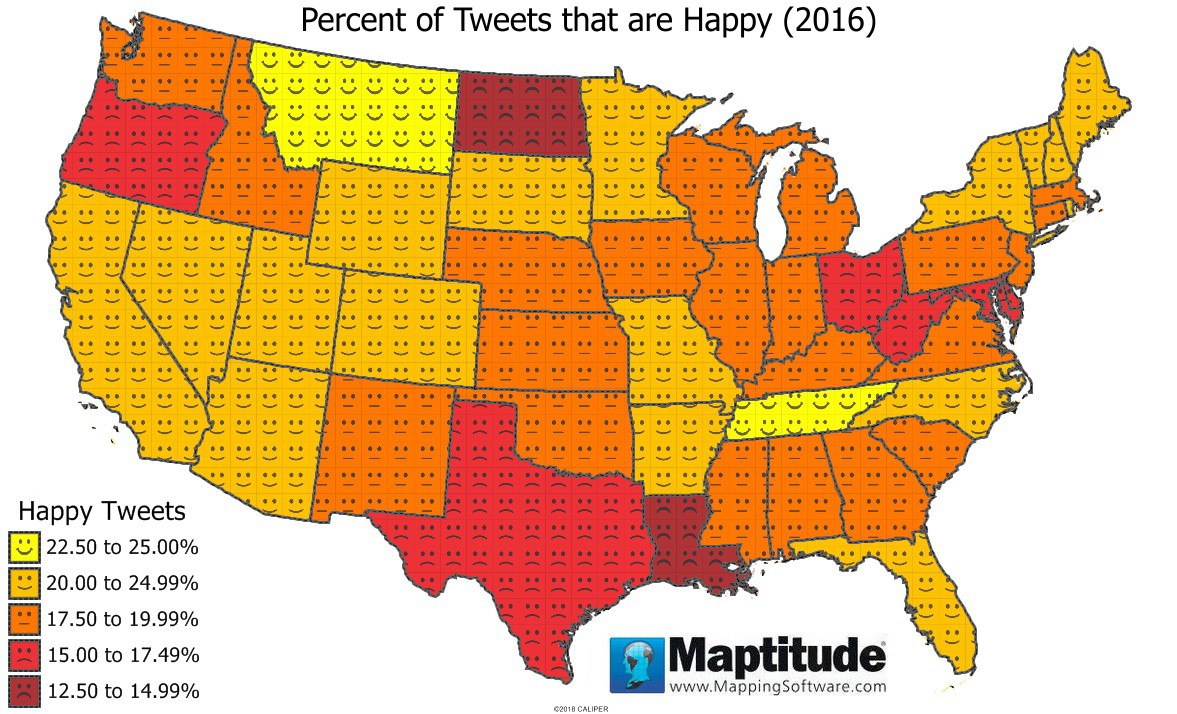
Map: Created with Maptitude Mapping Software by
Caliper, April 2018
Source: Nguyen QC, Li D, Meng H-W, Kath S,
Nsoesie EO, Li F, et al., Building a National Neighborhood Dataset
From Geotagged Twitter Data for Indicators of Happiness, Diet, and
Physical Activity, JMIR Public Health Surveillance 2016
Home | Products | Contact | Secure Store
