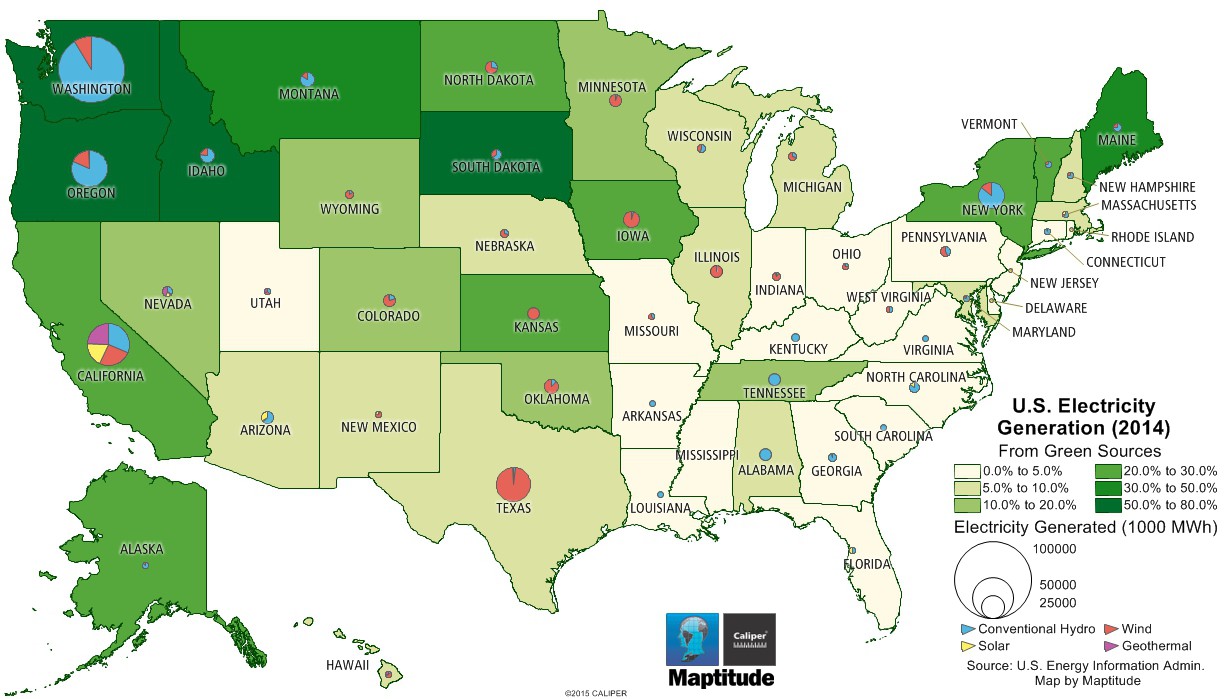
Maptitude is the best mapping software for business intelligence! This Maptitude map shows the percentage of electricity generated in each state from conventional hydro power, wind, solar, and geothermal. The pie charts show the total electricity generated from those sources in megawatt hours. The data are 2014 totals from the U.S. Energy Information Administration.
You can see that the Pacific Northwest and Northern New England get a substantial amount of electricity from these green sources, primarily from conventional hydro power. The plains states are also able to generate a fairly sizable portion of their electricity from wind power. Geothermal power is most prevalent in Nevada, Utah, and California, and solar power is most prevalent in Florida, Arizona, New Mexico, Nevada, and California.
Florida, Rhode Island, and Delaware generate less than 1% of their power from these four sources and Mississippi derives no power from these sources.
If you need a custom map for your story, blog, or website, contact us because we offer a limited number of free custom maps on a first-come, first-served basis! See our Featured Maps for inspiration.
Map: Created with Maptitude Mapping Software by Caliper,
September
2015
Source: U.S. Energy Information Administration, 2014
Home | Products | Contact | Secure Store
