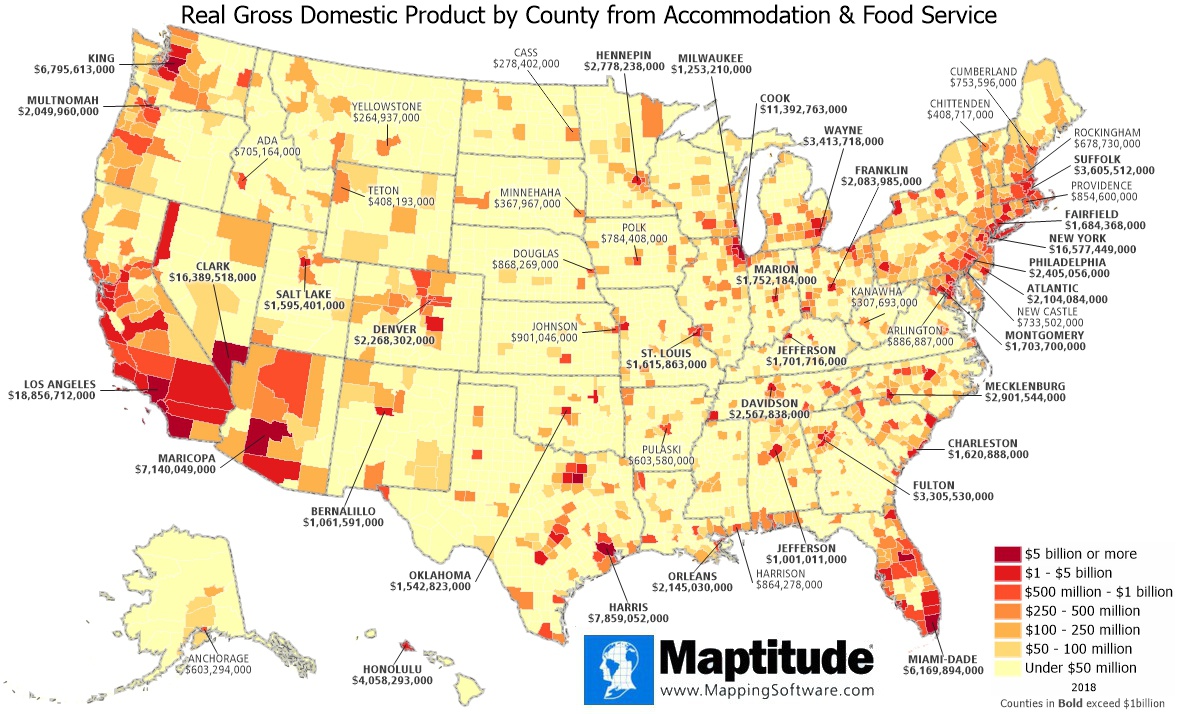
Maptitude is the best mapping software for business intelligence! Two sectors that are particularly hard hit by COVID-19 restrictions are food services and accommodations. This map illustrates just how vast those two sectors are in the United States. The color theme shows the annual GDP from food services and accommodations in each county. The labels indicate the county in each state that has the highest GDP from these two sources.
Overall, there are 94 counties where these sectors account for over $1billion of GDP per year, and four counties, Los Angeles CA, New York NY, Clark NV, and Cook IL where they account for over $10billion of GDP.
Maptitude includes 20 new county-level fields of GDP data that you can use in your analysis.
If you need a custom map for your story, blog, or website, contact us because we offer a limited number of free custom maps on a first-come, first-served basis! See our Featured Maps for inspiration.
Map: Created with Maptitude Mapping Software by Caliper, April 2020
#Maptitude #GDP #Food #Accomodation
Home | Products | Contact | Secure Store
