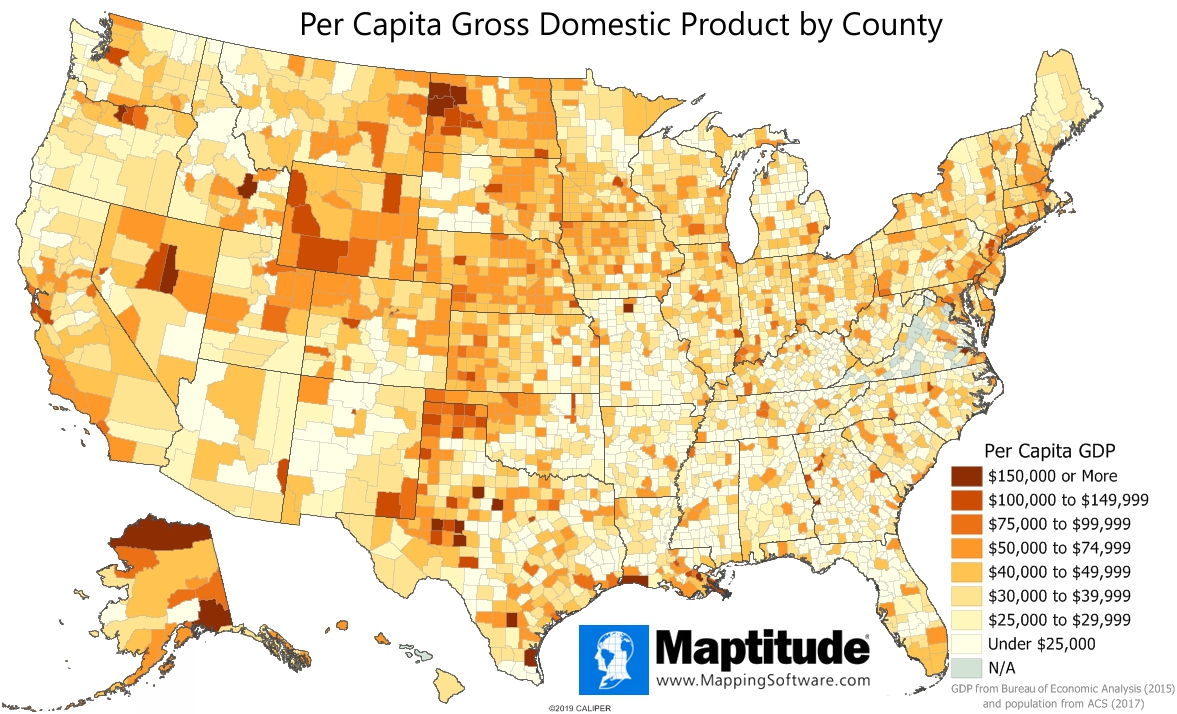
Maptitude is the best mapping software for business intelligence! This month's featured map shows the per capita value of goods and services (gross domestic product) by county in the United States. Maptitude now includes GDP data at the county and state levels. The data include total GDP as well as subsets of GDP from goods, services, and government.
While the counties with high populations dominate in terms of total GDP (Los Angeles CA, New York NY, Harris TX, and Cook IL being the top four), the top counties on a per capita basis include several much smaller counties. Eureka NV, North Slope AK, New York NY, and Shackelford TX all have a per capita GDP that exceeds $300,000.
If you need a custom map for your story, blog, or website, contact us because we offer a limited number of free custom maps on a first-come, first-served basis! See our Featured Maps for inspiration.
Map: Created with Maptitude Mapping Software by Caliper, March 2019
Home | Products | Contact | Secure Store
