Mapping Software and GIS Glossary
A color theme (also called a choropleth map) is a thematic map in which administrative areas are colored or shaded according to the range in which the aggregated statistic of interest falls. Color themes can also be used to represent non-ordered data. Unlike a heat map, a choropleth map applies colors to geographic areas such as states, counties, postal codes, or other features with defined boundaries.
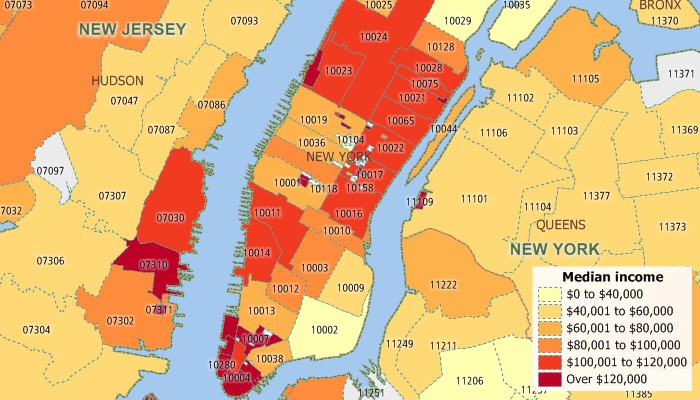
A color theme of quantitative data: This map uses color to illustrate the median income by ZIP Code in and around New York City. The darker the color, the higher the median income is in that ZIP Code.

A color theme of nominal data: This map uses color to illustrate how each parcel is zoned.
Maptitude Mapping Software gives you all of the tools, maps, and data you need to analyze and understand how geography affects you and your business. Create informative color themes that show the characteristics of your area of interest.
Learn More Free Trial Free for Students/Teachers
![]()
![]()
![]()
![]()
![]()
![]()
![]()
![]()
Home | Products | Contact | Secure Store
