Mapping Software and GIS Glossary
A Voronoi Diagram partitions a plane with points into polygons such that each polygon contains exactly one generating point and every point in a given polygon is closer to its generating point than to any other.
A Voronoi Diagram (also knows as Thiessen Polygons) can be used to show catchment areas for a group of facilities.
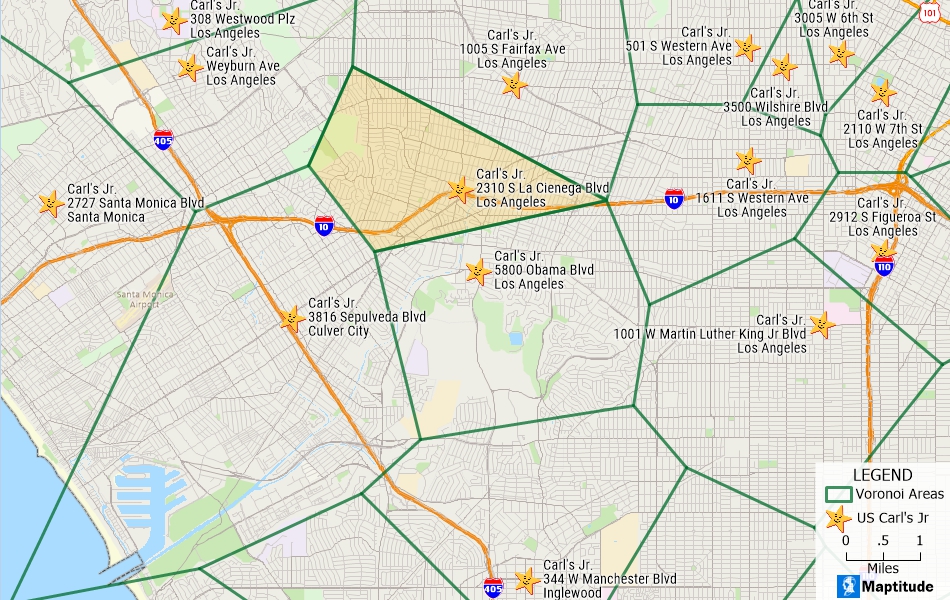
Voronoi Diagram in this map show the areas that are closest to each Carl's Jr restaurant. Anywhere in the shaded polygon is closest to the La Cienega Blvd restaurant.
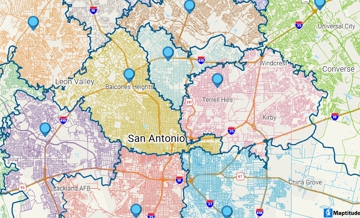
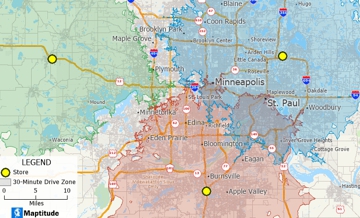
Maptitude Mapping Software gives you all of the tools, maps, and data you need to analyze and understand how geography affects you and your business. Define territories and areas of influence using Voronoi diagrams, network partitions, and other territory tools.
Learn More Free Trial Free for Students/Teachers
![]()
![]()
![]()
![]()
![]()
![]()
![]()
![]()
Home | Products | Contact | Secure Store
