Maptitude is robust and easy-to-use mapping software that incorporates three-dimensions (3D). Maptitude provides all the features that your organisation requires in order to take advantage of the geographic elements underpinning successful 3D, surface, and terrain-based projects.
Maptitude 3D mapping software costs only US$795 and is packaged as a one-stop-solution, shipping with all the tools required to allow infrastructure professionals (analysts, surveyors, architects, planners, civil engineers, geoscientists and designers) to model 3D data.
| Highlights |
|---|
|

Maptitude 3D mapping software offers a complete solution for professionals who need powerful, easy-to-use tools for visualising spatial data in three dimensions. From terrain modeling to enterprise GIS integration, Maptitude brings together everything you need in one affordable package.
Maptitude includes an easy-to-use but powerful 3D heat mapping tool that you can use to illustrate your data for area layers such as provinces, districts, municipalities, or sales territories. The 3-D theme tool supports the visualisation of two columns of data via choices for both colour and height. This mapping video shows how to create 3D thematic maps.
Maptitude can be used for 3D mapping in many countries including the USA, Canada, UK, Australia, Brazil and in many additional locations (more data…).
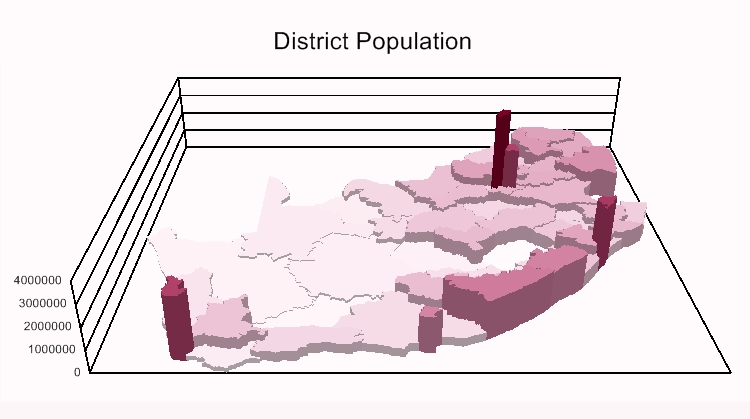
Aggregate your data to areas such as districts, sales territories, or provinces and visualize your data with 3D themes
 |
“Maptitude is a great alternative to [other mapping software]. Using Maptitude, I can easily create 3-D maps, heat/hot spot mapping, Areas of Influence (Thiessen Polygons), drive-time rings, flow maps (desire lines and spider maps), territory mapping, and spatial overlays (tagging features from one layer to another), trade area/site selection and much more.” Brett Lucas |
With Maptitude mapping software you can analyse and display surfaces on a 2D map or as a 3D View. You can prepare the surface from any point layer that contains elevation values, typically measured in metres above sea level. Maptitude can also create surfaces that represent data values such as measures of air pollution, levels of radon gas over a geographic region. These models may be used to generate contours or to interpolate data values at specific locations.
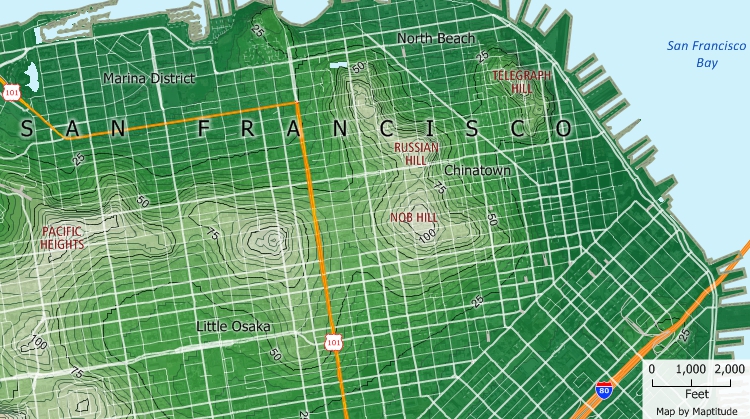
Maptitude 3D geographic software creates contour elevations and interpolates the elevation at any location
The Maptitude three-dimensional surface analysis tools and applications allow you to:
You can also use density grids to visualise point data by transforming the points into a regular grid. For example, you can identify customer or employment concentrations and then view the maps in a 3D View where higher concentrations are shown with a higher elevation.
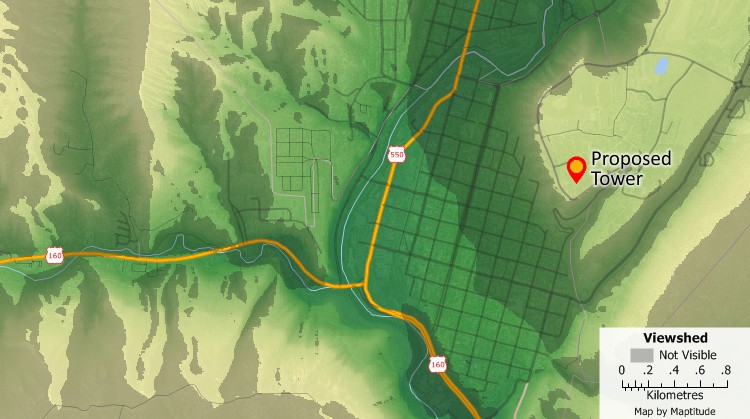
Viewshed analysis lets you find areas that are impacted by the construction of buildings, towers, wind turbines or let you identify good locations for fire towers or communications equipment
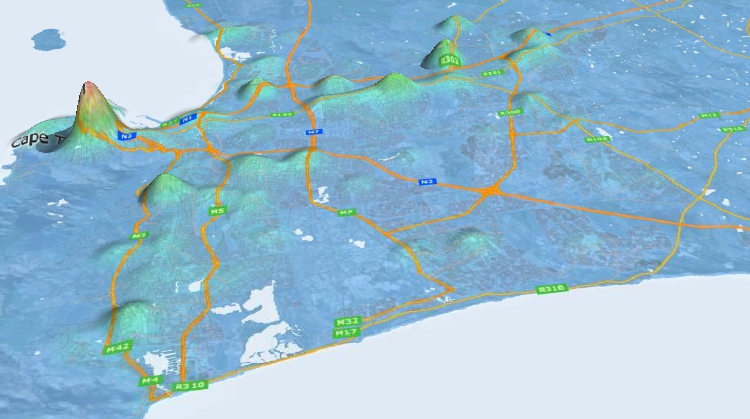
3D map software can show all sorts of data as elevations. In this map, locations with high retail concentrations around Cape Town are shown with a higher elevation.
The 3D View allows you to visualise maps in stunning and compelling ways, enabling you to explore locations with an audience in ways that just aren't possible in two dimensions (2D). By presenting your data in a realistic 3D perspective, decision makers, influencers and stakeholders will have better insights into your work.
You can build a 3D scene from the huge number of Maptitude model files, and users can add their own 3D buildings and scenery using any combination of SketchUp, VRML, or 3DS formats.
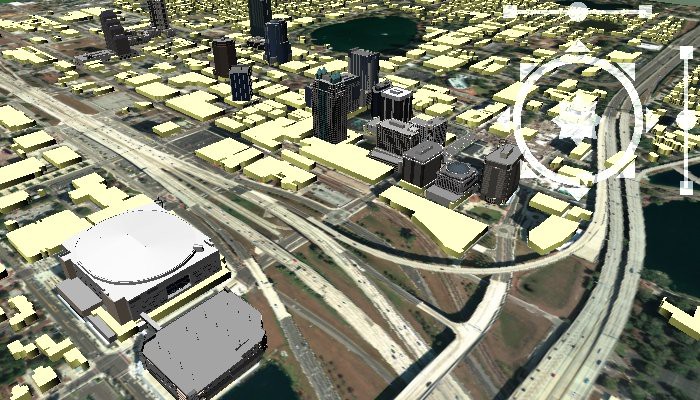
Maptitude 3D map making software produces maps that can contain 3D building models in addition to 3D topographic surfaces

|
“Maptitude GIS provides a sophisticated 3-D reality that looks professional as well as providing viewers with artistic and precise 3-D maps.” Dr. Aniruddha Banerjee |
Maptitude 3D mapping tools empower businesses, governments, and researchers to analyse spatial data with depth and clarity. Whether you're planning infrastructure, studying environmental factors, or optimising logistics, the 3D capabilities of Maptitude unlock critical insights.
Maptitude supports connectivity with a wide variety of geographic (raster/vector) and tabular databases such as Microsoft SQL Server and Oracle (See the Maptitude Data Access page for more information on supported data formats). Maptitude allows simultaneous editing of geographic and attribute data files by multiple users, and has native support for corporate databases (e.g., Oracle Spatial) for direct storage, editing, and access to all types of geographic data.
Maptitude runs on Windows, while Maptitude Online is accessible via browser-based interfaces, allowing use in the field via mobile devices.
With Maptitude, you can:
3D Views can be comprised of:
Once you have created a 3D scenario you can view it from various angles and move through the 3D landscape automatically using a flight path.
Maptitude starts at only US$795 and is packaged as a one-stop solution. Maptitude remains the most competitively priced professional 3D mapping software available and is unique in the marketplace for the provision of comprehensive data and functionality in a single product for a single low price.
Try Maptitude today and transform your spatial data into immersive, actionable 3D visualisations.
Home | Products | Contact | Secure Store
