
Author: Murtaza Haider
Housing experts in the US, including the Nobel Laureate Professor Robert Shiller, have expressed concerns about the recent acceleration in housing prices. Despite the housing alerts, mortgage delinquencies, a bellwether statistic for housing markets, suggests that the housing markets in the US are much more stable than they were in 2009-10. In fact, mortgage delinquencies have declined across all States, including Nevada and Florida where the share of mortgages being delinquent for more than 90 days peaked in 2009 and 2010. From a high of over ten percent in Nevada and over 8 percent in Florida, 90-day plus mortgage delinquencies are averaging below 2 percent across the US (Figure 1).
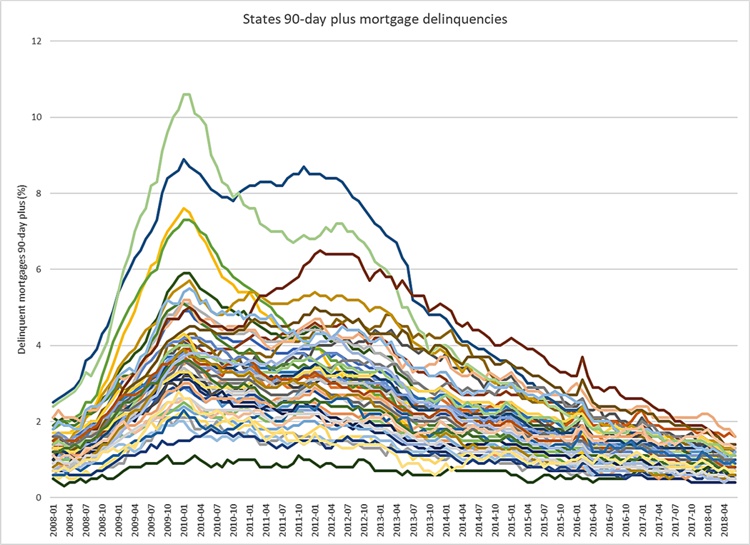
Figure 1: Mortgage delinquencies over time
Hidden in these statistics is the spatial heterogeneity. When the 90-day plus delinquencies are mapped, an East-Side story emerges: mortgage delinquencies in June 2018, despite being low, were relatively higher in the eastern and southern states than those in the west and mid-west (Figure 2).
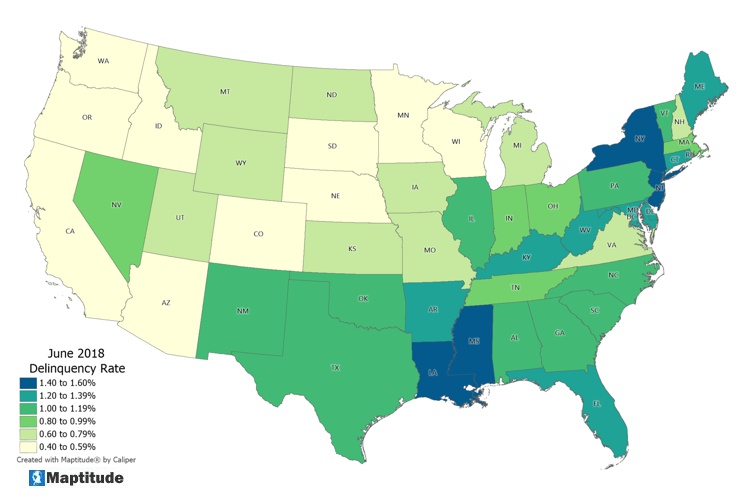
Figure 2: Spatial distribution of Mortgage delinquencies
But that’s not all. Once data are mapped, other spatial trends latent in data call out for attention. Note in Figure 2 that the darkest shaded States where the delinquencies in June 2018 were most pronounced are Louisiana and Mississippi, which happen to be the States with one of the highest concentration of African-Americans in the US.
This is not to suggest a causal relationship between race and delinquency. There could be numerous explanations other than the race. Also, note that the share of mortgage delinquencies is also relatively higher in some States where the African American share of the population is low. The purpose of this discourse instead is to demonstrate what one unexpectedly learns from visualizing spatial data.
My tool of choice for this exercise is Maptitude, a Geographic Information Systems (GIS) software by Caliper Corporation. It is one of the most affordable and feature-packed desktop GIS software in the market. It comes bundled with gigabytes of Census and other spatial data. I used the recently released version of Maptitude 2019.
I downloaded the mortgage delinquency data from the National Mortgage Database (NMDB) that is available at the State and County levels as comma separated values that can readily be imported into Maptitude.
Maptitude is shipped with, among many other data sets, Census data at numerous spatial hierarchies including States, County, and the Census Tracts. I opened the State level map in Maptitude and linked the mortgage delinquency data with it. Merging data took less than a minute. Subsequently, I was equipped with a data set that bundled the demographic data from the Census and the mortgage delinquency data.
With the data set in a GIS, a series of mouse clicks generated Figure 2. Note that I added the abbreviated two-letter State names to the map using the labelling tool.
I would like to overlay on the mortgage delinquency information the share of the African-American population in a State. This task is easily doable in Maptitude and requires a few mouse clicks. The result is presented in Figure 3 where the share of the African-American population is presented as circles whose size is automatically set as per the respective population share. The map legend at the bottom right describes the reference points for the distribution of colors and the size of the circles.
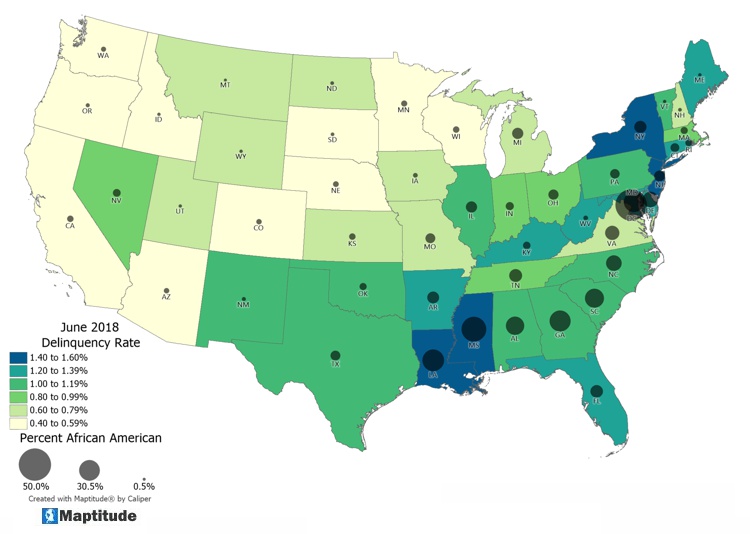
Figure 3: Mortgage delinquencies and the share of the African American population
The map shows a correlation between high African-American population shares and delinquencies in some States but not others. Kentucky, Maine, and West Virginia -- depicted by darker shades of green -- reflect higher mortgage delinquency rates. Yet the small size of the circles suggests fewer African Americans.
Using Maptitude mapping software, I generated a scatter plot with the African-American population share on the x-axis and the June 2018 mortgage delinquency rate on the y-axis. Figure 4 confirms my suspicion of a correlation between the two variables, which rise in tandem apart from the District of Columbia that registered the highest concentration of African-Americans on the scatter plot.
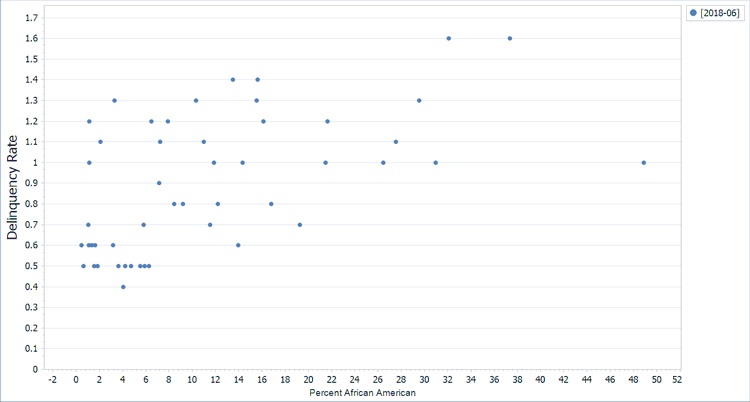
Figure 4: A scatter plot of delinquencies and the African American population
Mortgage delinquencies are tied to incomes and other socio-economic determinants. What if we wanted to control for other influential variables and then determine the relationship between the two variables of interest. This will require us to estimate a regression model. One can estimate an Ordinary Least Squares Regression model with ease in Maptitude.
Figure 5 presents the output from an OLS model showing that even when we control for median household income, median housing value, average household size, and median age, still one finds a statistically significant relationship between the share of the African-American population in a State and the rate of mortgage delinquencies.
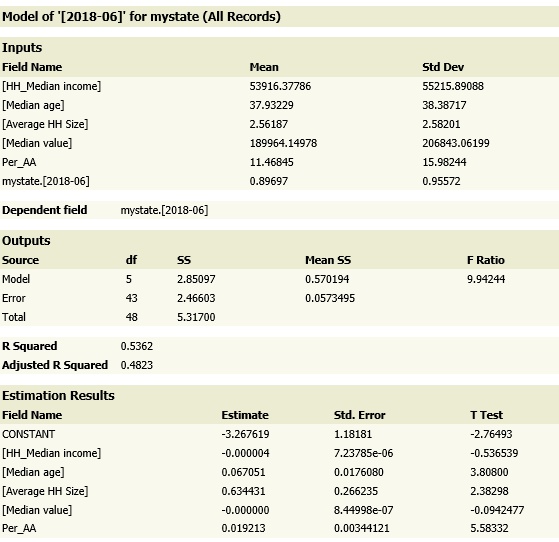
Figure 5: A regression model of mortgage delinquencies
In summary, a GIS can be an indispensable tool for researchers and practitioners who analyze spatial data, which might be masking important trends when analyzed aspatially.
With Maptitude, we were able to import data, merge it with Census data, plot maps and charts and estimate regression models.
For those interested in race and mortgage dynamics in the US, I recommend the following sources:
Learn more about Maptitude to see how you and your team can use Maptitude in data science and research analysis!
Schedule a Free Personalized Demo
Home | Products | Contact | Secure Store