
Author: Richard Marsden
In this example, we perform a number of analyses of restaurant (point) locations across the UK. We follow this with a similar analysis of aggregate (area) US business location data. Here is our input restaurant data. This is point data which has been geocoded with Maptitude:
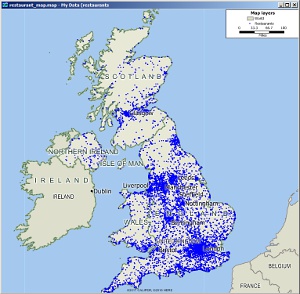
Base map of restaurant locations
This map clearly shows some natural clusters according to population. For example, there's a large cluster around London, and a number of smaller clusters in the Midlands / Lancashire / West Yorkshire area. We can use MPCluster* for Maptitude to identify clusters in point data like this:
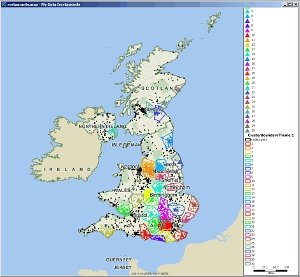
Cluster analysis of the restaurant data using MPCluster
Individual clusters are marked with their own colors. This kind of analysis could be used to identify territories, for example for a restaurant supplier, or distribution depots for a large chain of restaurants.
MPCluster* can take into account data fields on the restaurant data. So for example, you could create clusters of total restaurant sales.
Areas not covered by dots and clusters, could also be used to identify potential new restaurant locations. However this kind of analysis is limited because it does not take into account populations. An area such as the north of Scotland probably does not have many restaurants because there are insufficient people to support them.
Maptitude's own Overlay feature can be used to add up all the restaurants in a group of areas. For example, here we have a map shaded according to the number of restaurants in each Postcode District:
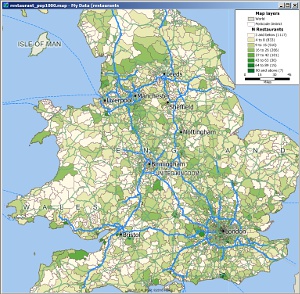
Total number of restaurants per Postal District
Not unexpectedly, there is a large variation in the number of restaurants per postal district. Some inner city areas have over 90, whilst some rural areas are less than three. Interestingly, some rural postal districts have quite high counts. These are typically because they cover a large area and include at least one regional town. However, again, many districts will have low restaurant counts because they simply do not have the population to support many restaurants.
We can correct for this by modifying the theme from "Number of Restaurants" to "Restaurants per 1000 population" by using a custom formula, to give the following result:
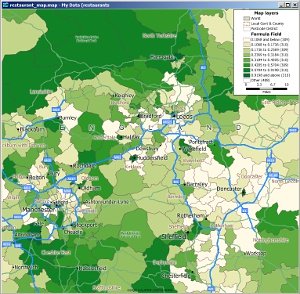
Detail of Northern England showing Restaurants per 1000 Population
Here the map has been zoomed into an area centred on Northern England for clarity. We can quickly identify districts that have few restaurants for their populations. Typically they are suburban areas.
Interestingly rural areas (e.g. in the north of the map) have high restaurant/population counts. This is because they have some restaurants but very low population. city centers also have high counts. Although they have a higher population, there are many more restaurants.
However, suburban areas have few restaurants for their population, because they have high populations and relatively low restaurant counts. This is probably because people can easily travel to the local city center.
Therefore the above map could be used to identify potential postal districts that are under-served by restaurants, but care should be taken regarding population mobility between districts. Suburbs might appear attractive, but you might be competing against large numbers of restaurants in neighboring districts.
These maps give you a 'taster' of the kind of analyses that can be performed. They could easily be extended by using the demographic data that is provided with Maptitude to target specific income brackets, ethnicities, etc. Similarly, you could work with specific types of restaurant.
A similar approach can be used with Caliper's 2018 Zip Code Business Counts. This data is free for existing Maptitude users, and provides business counts by category for each zipcode in the USA. Businesses are categorized by NAICS code. With a data field for each code, and summary totals for each sub-category, there are a LOT of data fields. It is recommended users read the accompanying PDF guide which gives some tips as to how to handle this data.
Here we plot Educational Support Services companies with red dots sized according to the number of companies in each zipcode. If those represent potential customers, we can cluster these to find potential new market territories. We do this by setting the Constrain sum setting in MPCluster* to set upper and/or lower limits on the number of businesses within each cluster. Here are the results for an area including TX, OK, AR, and LA:
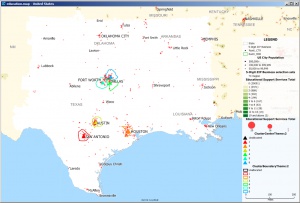
Clusters of companies providing Education Supply Services
Note that Oklahoma City, New Orleans, and Memphis are not quite big enough for a cluster with these settings, but the Dallas-Fort Worth Metroplex is big enough for three clusters!
As the base data contains all NAICS codes, this approach to find clusters for any business type in the USA.
*Maptitude is a replacement for the discontinued MPCluster, MileCharter, and MPMileage plugins
Learn more about Maptitude to see how you and your team can use Maptitude for your restaurant planning needs!
Schedule a Free Personalized Demo

Home | Products | Contact | Secure Store
