
Author: Murtaza Haider
Dealing with spatial data could be challenging when new data has to be synthesized based on the location of existing observations. For example, I recently ran into a challenge when I was working with geocoded real estate transactions. I needed to create a new Territory or District map to represent aggregated statistics from the underlying data comprising tens of thousands of observations. I relied on Maptitude GIS for finding a solution to my spatial data science problem.
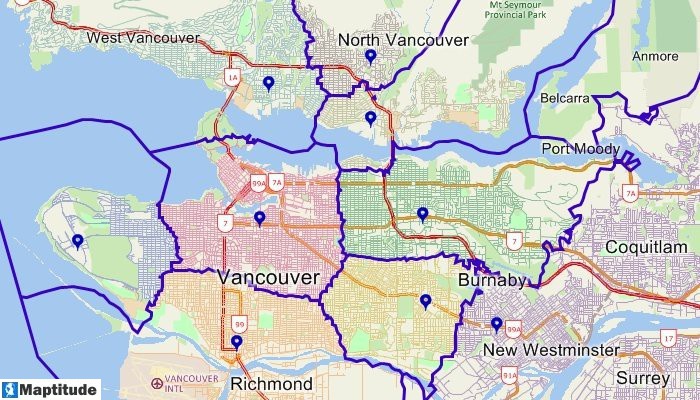
The following map depicts housing transactions in the greater Toronto area. I am interested in aggregating the disaggregate data into districts or communities. My data set has a variable that identifies the community to which each transaction belongs. However, I do not have the territory map.
I found an efficient and straightforward solution in Maptitude. Essentially, I needed the transaction data in point format coupled with the spatial data shipped with Maptitude that includes maps for the census geography, including census tracts, which are polygons delineated by Statistics Canada where each tract’s population ranges between 2000 to 8000 people with an average of 4000 persons per census tract.
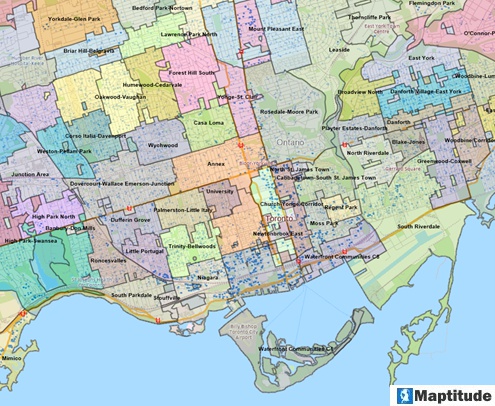
The community variable in my data set will need to be a polygon map where each polygon is aggregated from the smaller-sized census tracts. Thus, Maptitude’s algorithm will read the community information from the variable in my data set and then use the location of individual records to attach them to a census tract that will be aggregated to form a community boundary. The resulting Territory or District map is presented below.
Spatial analytics enable analysts to harness insights latent in the location of your data. A powerful GIS software, such as Maptitude, will help you make the best use of your spatial data. For details on the Maptitude’s territory creation algorithms, please watch an illustrative video at the link below:
Learn more about Maptitude to see how you and your team can use Maptitude in data science and research analysis!
Schedule a Free Personalized Demo
Home | Products | Contact | Secure Store
