There are many benefits when you use Maptitude mapping software to turn your Excel data into maps:
Free Trial Request Demo Learn More
Maptitude is competitively priced and enables organizations and businesses to use their location-based data to improve decision making. Why spend more for less?

|
“It is the most user-friendly mapping software I've used so far (compared to Power BI, Tableau, Excel 3D Maps). Any time I've need help, the user support was very responsive and helpful. I haven't found anything I dislike yet. It is easy to use and navigate around. It is solving how we locate our potential targets. By placing different layers across the map, we can see distance and boundaries from our targets to our facilities.”
|
 |
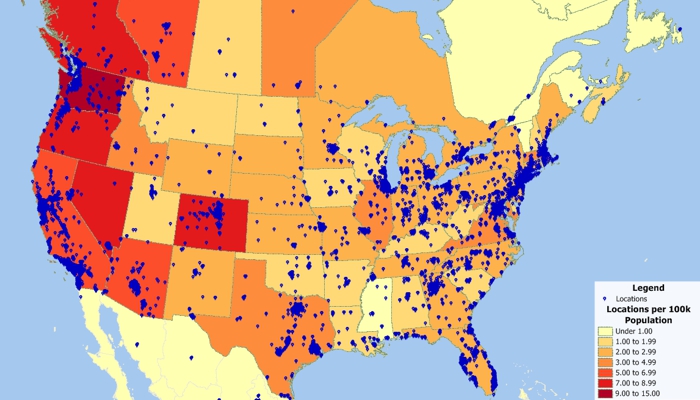
“Maptitude is excellent for doing geographic analysis projects looking at: where existing customers are and new ones might be (including using the built-in demographic data); identifying hot-spots, patterns and trends that can't be seen in Excel. It is really helpful with network design tasks - which sites are best: centres of gravity; visualising size of flows between distribution centres; allocating volume to different depots.”
|
 |
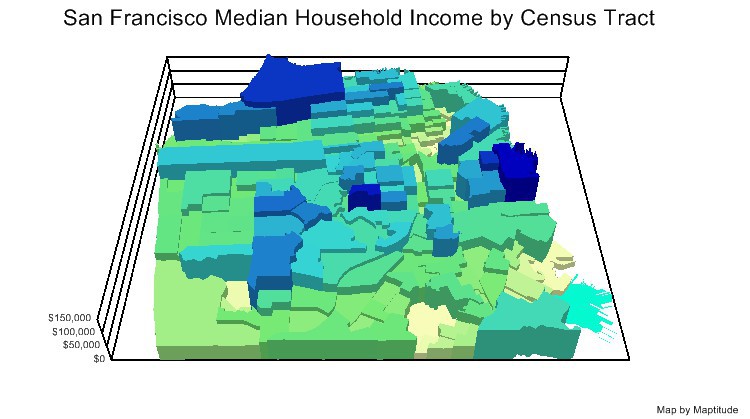
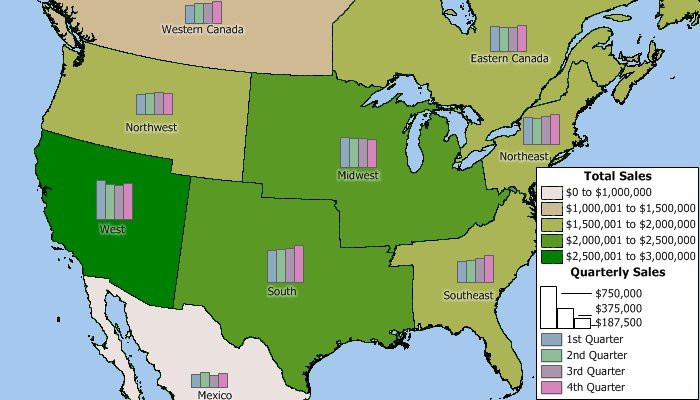
“Maptitude supports all of MapPoint and Powermap’s data plotting options out-of-the-box. It can plot Column Maps (Prism Maps), Bubble Maps (pie charts), Heatmaps, and Regions (area layers); and does not require a subscription or an Internet connection.”
|
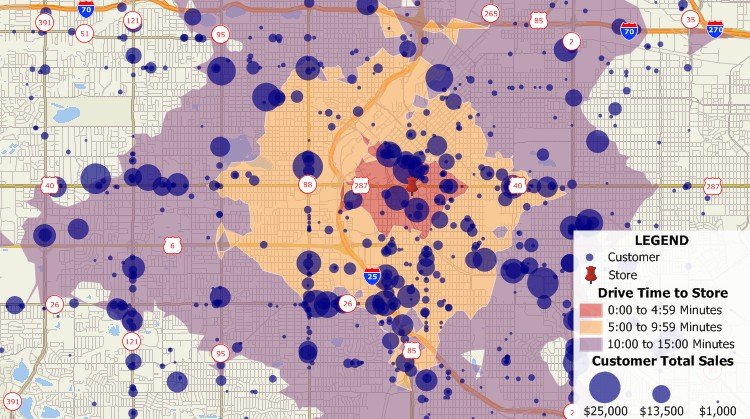
√ Maptitude is the easiest-to-use full featured mapping software, and includes powerful tools such as multi-ring drive-time zones
√ Maptitude has no subscription fees, and supports secure off-line data storage
√ Maptitude provides fully customizable maps with unlimited point icons
√ Maptitude has unlimited pin-mapping/geocoding
√ Maptitude includes free mapping data and demographics covering everything from population statistics to business locations, postal/ZIP Codes, and more!
Free Trial Request Demo Learn More
More Information:
 Check out our G2 Reviews
Home | Products | Contact | Secure Store
