Maptitude Help / Introducing Maptitude / Maptitude Basics
Maptitude Basics
Maptitude combines many components into one package:
- A tremendous storehouse of data you can use to create detailed maps.
- A collection of capabilities for displaying, editing, and working with your own business data.
- Ways to link the built-in information to your own data.
- An assortment of tools for analyzing, interpreting, and presenting information using maps.
The topics below introduce basic concepts that are helpful to understand when working with Maptitude:
- The Maptitude Screen
- Workspaces
- Toolbars
- Geographic Files
- Layers
- Labels
- Map Scale and Location
- Themes
- Selection Sets/Filters
- Geographic Analysis Tools
- Custom Application Development
 |
For a video tutorial see: (Internet connection required) Maptitude Basic Concepts: An introduction to Maptitude toolbars, help, shortcuts, context-sensitive menus, the working layer, and workspaces |
The Maptitude Screen
The Maptitude screen resembles many other Windows applications. Like most Windows programs, you use Maptitude by choosing commands from the menus or by using command buttons and tools in a toolbar. Toolbars can either be docked or floating. You can also right-click to choose from context-sensitive menus. Some commands and tools can be used only at certain times. When a tool or command cannot be used, it is displayed in gray. Commands also have hotkeys that are used by pressing the Alt key and the underlined character in the menu item.
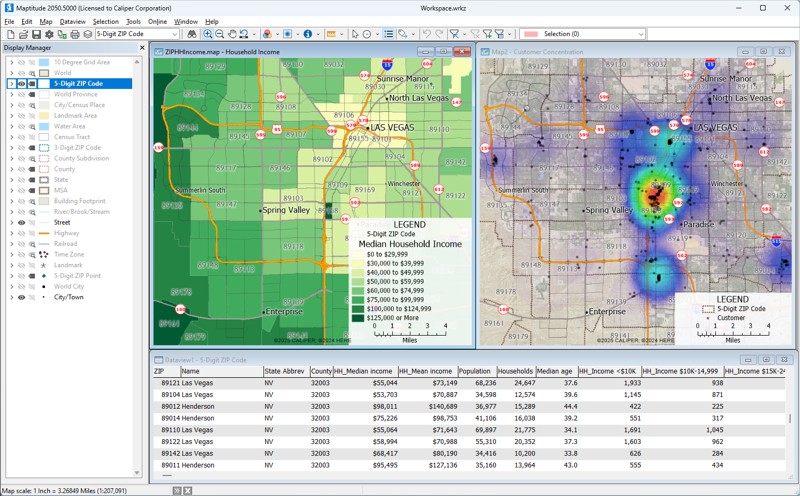
Maptitude displays information in different types of windows. For example:
- Map windows show geographic features and their characteristics. You can choose the features you want to see and how you would like to see them.
- Dataviews display information from geographic files, databases, or spreadsheets in tabular format. In a dataview you can display and edit data, customize the way the data are displayed, perform statistical analyses, or link your own data to features on a map.
- Figures show 3D themes and surface profiles.
- Charts let you display tabular data as bar charts, pie charts, scatter plots, and more.
- Layouts bring together any number of maps, dataviews, and figures in a single presentation and allow you to add freehand text, drawings, your company logo, and more.
Windows that are open are listed in the Window menu. You can have any number of map windows open in your workspace.
- If you have more than one window open, you can arrange the windows as follows:
Workspaces
Workspaces are where you display one or more map windows, dataviews, charts, or layouts. You are required to either open an existing workspace or create a new one when you work with Maptitude. When you save your workspace, all of the open windows will be saved, and if you close and reopen the workspace, all of the windows are restored.
Maptitude compressed workspace (.WRKZ) files store your tables, layers, and analysis results within the workspace. Compressed workspaces offer much simpler file management and make it much easier to share your maps because all of the necessary files are stored within the workspace file rather than in separate files. Compressed workspace files are the recommended workspace file to use.
 |
NOTE: The Country Package data are not compressed into a WRKZ workspace. If you share a workspace that contains any of the Country Package layers (e.g., streets, landmarks, states, etc.) then the same Country Package is required to completely display all of the maps in the workspace. |
You can also use standard (.WRK) workspaces that were part of previous versions of Maptitude. When you work with standard (.WRK) workspaces, Maptitude will prompt you to save tables, layers, and various analysis results in separate files. You should make a project folder on your computer for storing these files so as to make it easier to locate the files if you plan to share your workspace. You can convert your existing .WRK workspaces into compressed workspaces by using the File>Save Workspace As command and choosing Workspace - Compressed as the file type. Any standard geographic layers (such as those created by geocoding or using one of the analysis tools) will automatically be embedded into the new file.
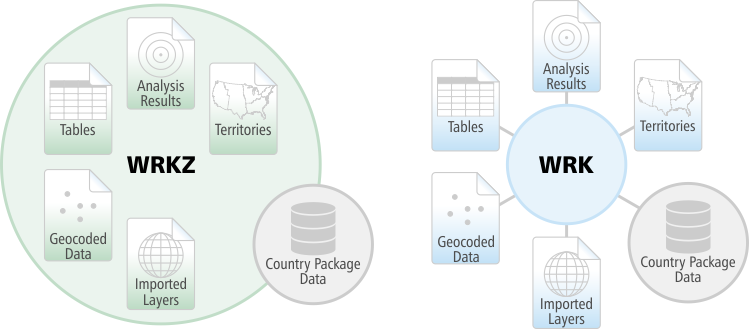
Compressed WRKZ workspaces will store your geocoded data, tables, territories, analysis results (buffers, drive-time rings, density grids, etc.), and imported geography directly. Standard WRK workspaces require all of those files to be saved separately and contain just the links to those external files. Country Package data are treated the same in both workspaces.
 |
Standard .WRK workspaces are not backward compatible and once saved in Maptitude will not open in prior versions of Maptitude. |
Compressed workspaces are created by default from the Home dialog box. You can change the default to standard workspaces by choosing Edit Preferences and removing the check from the Use compressed workspace option on the System tab.
Toolbars
Toolbars can be turned on using commands from the various menus. You can customize the toolbars by choosing which ones are displayed and whether they are floating or docked. Floating toolbars can be resized or docked on any side of the Maptitude screen.
 To Dock Floating Toolbars
- Drag the title bar of the toolbar you want to dock to any side of the Maptitude screen.
To Resize Floating Toolbars
- Position the cursor over one of the edges of the toolbar.
- Click and drag until the toolbar is the shape you want.
To Float Docked Toolbars
- Click and drag the vertical bar on the left side of a docked toolbar.
To Hide Toolbars
- Click the Close button on the right side of the toolbar’s title bar. The Standard toolbar cannot be hidden.
Geographic Files
Geographic files are special databases that store the geographic information that Maptitude uses to draw maps. Each geographic file is drawn on a map as a layer. Geographic files are installed separately from the software and are provided for a single country or geographic area as a region. You can have more than one region installed for use with Maptitude, and you can add and remove regions with the Region Manager.
Each region includes an extensive library of geographic and demographic data that help you get your projects started quickly. Typically, the geographic files in a region include a street layer with address ranges for geocoding, a highway layer, political boundary layers (e.g., states, provinces, counties), a railroad layer, point and area landmark layers, river and waterway layers, and a populated place layer. In addition, some regions may include a postal boundary layer (e.g., ZIP Codes in the U.S., Postcode sectors and districts in the U.K., Postcodes in Australia), census geography layers (e.g., Tracts in the U.S., Census Divisions and Subdivisions in Canada, Output Areas in the U.K.), and legislative boundaries (e.g., Westminster Constituency Boundaries in the U.K., Territorial Authorities in New Zealand).
Several world geographic files are also provided with Maptitude. These include cities, countries, provinces (where available), and a world gazetteer.
|
NOTE: For a complete list of the geographic files included with a region, choose Help>Region Data and choose a region from the submenu. For more information on the Region Manager, see Using the Region Manager. |
Maptitude also provides comprehensive tools for creating, editing, importing, and exporting geographic data. Maptitude has an open systems architecture with extensive support for data exchange. This lets you import data from, and export data to, most popular DBMS, CAD, and GIS software packages. Maptitude also lets you directly use Esri Shapefiles and Personal Geodatabases, MapInfo TAB files, Oracle Spatial tables, and any ODBC table with a coordinate as a map layer.
Layers
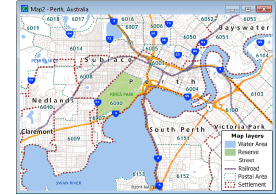 Maptitude organizes all of the features in a map by layer. When you create or work with a map, you choose the layers you want to see and decide how each layer should look. For example, this sample road map of Perth, Australia contains separate layers for water areas, reserves, settlements, postal areas, streets, and railroads.
For more information on layers, see Changing the Contents of a Map.
Labels
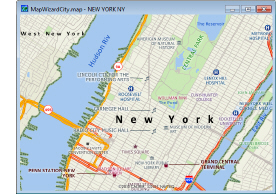 Maptitude lets you label each feature on a map with its name or any other attribute. Maptitude lets you choose label position, size, color, style, and priority. In addition, you can move individual labels to suit your needs, use callouts, and rotate labels. For example, this map of New York City contains several labels that are rotated, several that have callout lines, and several that have customized styles.
For more information on labels, see Using Labels.
Map Scale and Location
While a paper map shows a fixed geographic region, Maptitude lets you move around the map from place to place, zooming in as you like, to see more and more geographic detail. You can use autoscaling so that layers appear automatically as you zoom in.
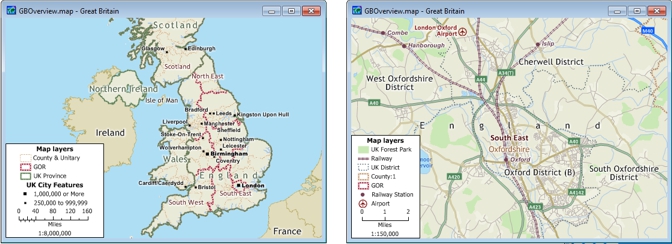
If you often want to look at one or more particular locations, you can save those locations by creating a bookmark. You can quickly zoom to the location of a bookmark from any map, or create a map based on a bookmark by using the Map Librarian. You can also use an overview window to show the location of a map and move the map to a new location.
For more information on changing the map scale and saving bookmarks, see Moving Around a Map. For more information on autoscaling, see Controlling Layers Automatically with Autoscale.
Themes
A theme (or choropleth map or heat map) is a way to illustrate the data that go with a map layer. Maptitude lets you create many types of themes that use colors, patterns, charts, and symbols to make informative maps. When you create a theme, you choose the data you want to use and the type of theme you want. You can let MapWizard® automatic mapping do the rest, or customize the settings for the theme to make your map look exactly the way you want.
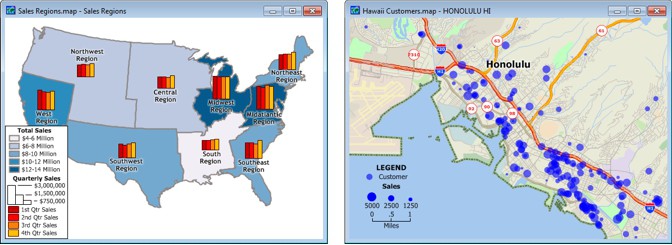
A territory layer with both a color and chart theme of sales data (left) and a customer layer with a size theme showing sales data (right)
For more information on themes, see Using Themes to Present Information .
Selection Sets/Filters
Maptitude provides tools for asking and answering questions about the features in a map and the data in a dataview such as which customers are more than 10 miles from a store, which ZIP Codes have a median household income over $75,000, or combination questions such as which tax parcels are zoned single-family residential and within 1/2 mile of a school? Maptitude stores the answers to these questions in selection sets which can be highlighted on a map or in a dataview.
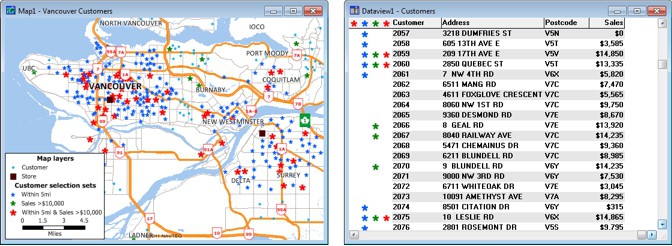
A map and dataview showing customers filtered by their proximity to stores, their level of sales, and a union of the two
For more information on filters and selection sets, see Queries and Selection Sets.
Geographic Analysis Tools
One of the best reasons to use a GIS is to unearth and analyze the geographic components of your data. You can create buffers (bands) around map features, create territories, define areas of influence and market catchment areas, find routes, identify hot spots, generate contours, and much more. Maptitude also makes it easy to overlay and aggregate data and compute statistics.
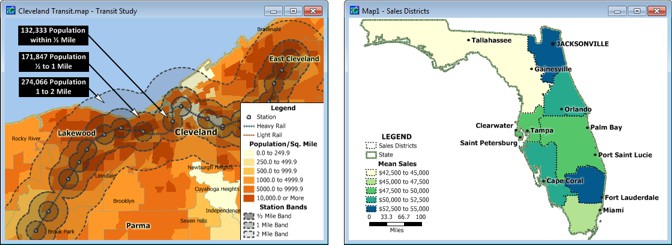
Buffers around train stations (left) and custom sales territories (right)
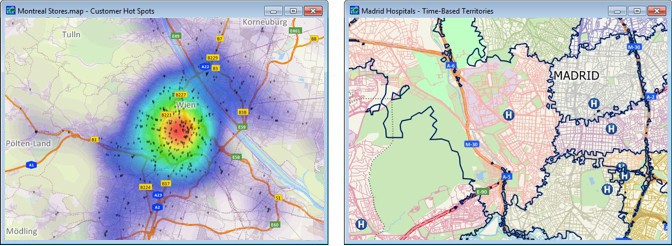
Density grid hot-spots showing customer concentrations (left) and territories based on drive-time (right)
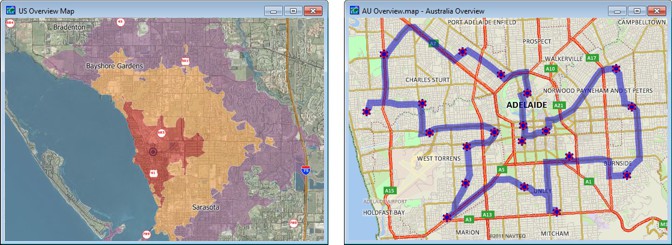
5-minute interval drive-time rings (left) and route optimized to efficiently service customers (right)
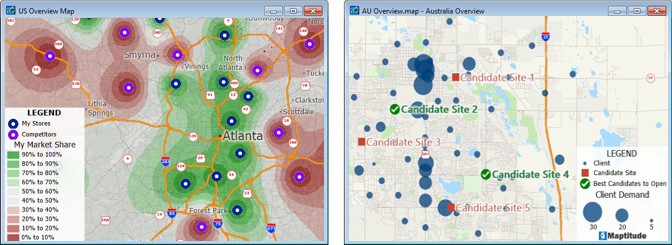
Huff market share analysis (left) and site selection analysis (right)
See Geographic Analysis Tools, Routing, Directions, and GPS, and Surface Analysis Tools for more information on the analysis tools in Maptitude.
Custom Application Development
Maptitude includes the Geographic Information System Developer’s Kit (GISDK™). GISDK gives you the tools that you need to create a wide variety of products for delivering mapping and geographic analysis capabilities to your customers. Almost 800 functions can be called from Caliper Script, a complete programming language for designing menus, dialog boxes, and toolbars and for writing macros. The Caliper Script code is stored in resource files that you can edit with your favorite text editor. With GISDK you can:
- Create add-ins or macros that extend the capabilities of Maptitude or that automate repeated operations. Add-ins can be freely distributed to any Maptitude user without restriction.
- Build custom applications that focus the user on the capabilities needed for a particular purpose by extending or replacing the standard Maptitude interface. You design the menus, toolbars, and dialog boxes, and program the application to respond to user actions in any way you want.
- Access Maptitude from .NET to integrate it into a .NET application or access Maptitude as a COM Object to add maps or analysis functions to your own programs. The .NET classes included with Maptitude allow you to access the GISDK environment from a Windows desktop application (Windows Forms) written in any .NET language such as C#, Python, Visual Basic, etc. GISDK also allows you to call GISDK functions and macros from another application using COM. Maptitude can provide map, data, and geographic analysis services when accessed as a COM Object. You write your application in a programming language that can make COM calls, and when you need map services you call the Maptitude object to supply those services.
Choose Help>GISDK Help for more information on GISDK.
For web mapping applications, there is Maptitude Online. For more information or to explore custom web solutions, contact Maptitude sales at 617-527-4700.
©2026 Caliper Corporation