
Author: Richard Marsden
Here we demonstrate the usage of MPCluster* with Caliper Maptitude to perform a real world example of geographic cluster analysis.
This example was kindly provided by Lucassen Consulting. The objective is to find warehouse locations for a retail company operating in Western Europe. These locations will be based on delivery locations, with each warehouse located at the center of a delivery location cluster.
Initial data is based on the number of shipments by postcode. These have already been consolidated over a month, so each postcode location has total delivered weight and total number of packages.
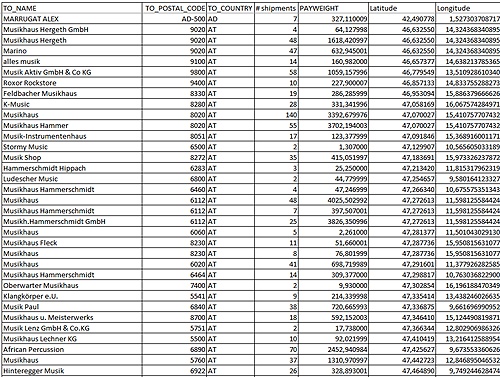
Sample of the input data, courtesy of Lucassen Consulting
First we import this data into Caliper Maptitude as a point layer. Here is the imported data with delivery locations marked with small black disks:
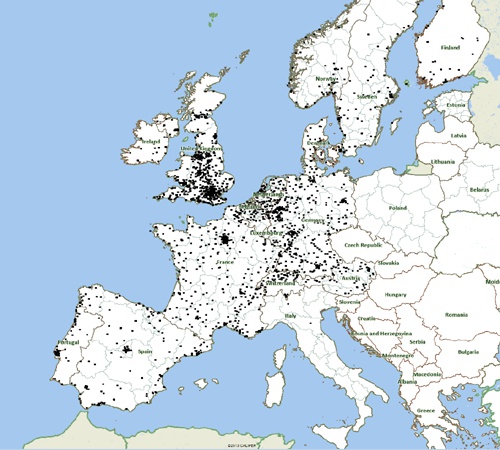
Input data locations marked as black dots
To start the clustering process, we select MPCluster: Run… from Maptitude's Tools menu. This displays the main processing panel:
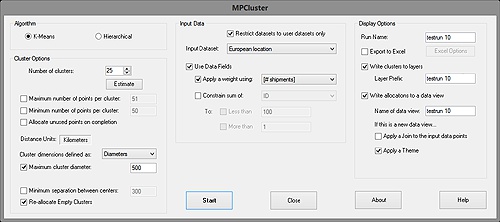
The main MPCluster panel
Rather than testing all possible cluster configurations (which would take many years even for small datasets), MPCluster* uses one of two algorithms. Here we use the stochastic algorithm known as "K-Means". This starts with a "good guess" and then iteratively tries to improve it. This means that multiple runs with identical parameters can give varying results. It is also possible to apply too many constraints making stable solutions impossible (or very difficult) to find. Hence after computing a set of clusters, MPCluster* will report the number of clusters found and a stability percentage. This is the percentage of data points that are stable and are not changing with each iteration. You should aim for a very high percentage — e.g. over 90%. A low percentage (e.g. 20%) typically indicates that a stable solution satisfying the constraints cannot be found. Try reducing and/or removing the constraints.
Due to this, MPCluster's* K-Means algorithm can sometimes require a little bit of trial and error to find good parameters that produce a usable result.
In the above configuration, we only apply one constraint: Clusters have a maximum diameter of 500km.
Some delivery locations are more important than others because they receive more deliveries. We have data for the total weight of deliveries, and the number of shipments. We shall use the number of shipments – this is the "# shipments" data field. Rather than use this as a constraint, we shall use it as a weight. A constraint would add a minimum and/or maximum value for the sum of this data field. The weight will simply use the data field to pull the cluster's center towards pushpin(s) with high "#stops". Do this by setting the Use Data Fields and Apply a weight checkboxes, and selecting "#stops" for the weight the data field.
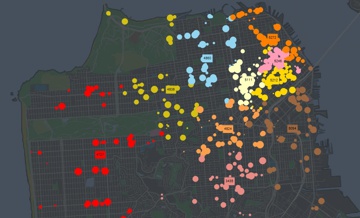
Next we set the cluster display options on the far right. These are set to create new layers marking the cluster centers and boundaries. The output data points are also written to a data view. It is not used here, but MPCluster* can also join this data view to the input data and color the input data according to their cluster allocations.
Although we do not use the ability here, MPCluster* can also export all of the data points and cluster allocations to Excel. This is controlled using the Export to Excel checkbox and the (currently hidden) Excel Options button on the main MPCluster panel.
Finally, we choose the number of clusters to find. MPCluster does have the ability to estimate the number of clusters present in the data. This is only an estimate and should only be used after setting all of the other parameters. Press the Estimate button to display the Estimate the Number of Clusters dialog box:
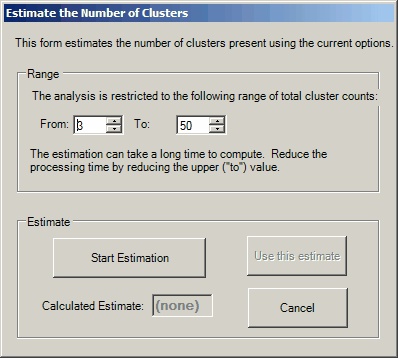
The MPCluster Estimate the Number of Clusters dialog box
Set the range of cluster counts to search and press Start Estimation. Note that this can be time consuming for large numbers of clusters, so it is strongly recommended that you restrict the range as much as possible.
Back on the main panel, you will see we have actually used a count of '25'. Press Start to start processing.
Here are the results:
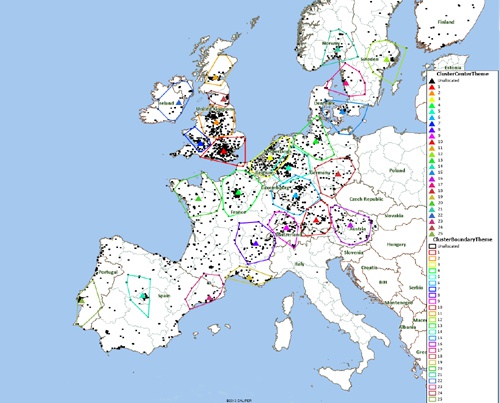
Results from MPCluster
Each cluster center is marked with a solid triangle and a boundary of a matching color. MPCluster* can also use the same color for the component data point, but this has not been used in the above map.
Here is another run that has been set to find larger clusters:
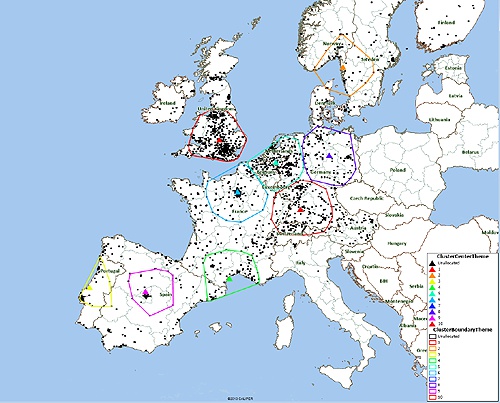
Sample MPCluster output with larger clusters
As mentioned, the K-Means algorithm benefits form multiple runs. You may also wish to try varying different parameters, e.g. the second map with larger clusters. The display quickly becomes quite 'busy' with multiple cluster runs displayed, but Maptitude lets you easily show or hide the output layers using the Display Manager:
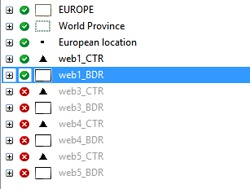
Close-up view of the Maptitude Display Manager. Here the layer display for run 'web1' is enabled, but the others (web3, web4, and web5) are all disabled
The above examples demonstrate MPCluster's* K-Means algorithm. The Maptitude version of MPCluster also introduces a new algorithm known as Hierarchical Clustering. This algorithm is deterministic – i.e. the same parameters and data will always produce the same results. It also tends to be faster. The available constraints are slightly different – for example, you can specify whether the cluster centers are centroids (i.e. mean) or a medoid (i.e. restricted to the input data points). Also, hierarchical clusters tend not be as circular in shape.
This completes this example of MPCluster* being used to find delivery territories and warehouse locations for a European retailer.
Thank you to Paul Lucassen of Lucassen Consulting for the above data.
*Maptitude is a replacement for the discontinued MPCluster, MileCharter, and MPMileage plugins
Learn more about Maptitude to see how you and your team can use Maptitude for your business mapping needs!
Schedule a Free Personalized Demo

Home | Products | Contact | Secure Store
