

Author:
Stewart Berry
Images: Dan Martin
In this post we explain how Maptitude mapping software can aid in the mapping and analysis of the housing market, allowing you to explore housing market trends and home valuation data.
Housing that is both high-quality and financially attainable is vital to a family's well-being. However, housing costs in some locations are so high that many families are unable to afford this necessity. Housing prices fluctuate depending on market circumstances and vary throughout the country necessitating analytical tools that can handle large amounts of data at varying geographical levels to build a comprehensive picture of the housing market.
Read on to learn how Maptitude can easily map data on residential housing, showing variations in home prices, valuation, and new construction across both time and space!
Maptitude has information that enables you to make reliable and well-informed judgments based on a variety of demographic and economic data. All the Census boundaries available with Maptitude, as well as 3- and 5-digit ZIP Code areas, include multiple demographic profiles based on Census data and the most recent American Community Survey (ACS) results.
Census and ACS data are provided down to Census Tracts in Maptitude. There are also additional smaller boundaries called Blocks and Block Groups available separately should you need even greater detail. For housing you can map the number of units by value, by mortgage costs and by income, and by rent paid and by income.
Housing Unit Value and Costs Data in Maptitude
Owner-occupied units Value:
<$50K, $50K-99,999, $100K-149,999, $150K-199,999, $200K-299,999, $300K-499,999, $500K-999,999, $1,000,000+, Median value
Housing units with mortgage Monthly Costs:
<$300, $300-499, $500-699, $700-999, $1000-1499, $1500-1999, $2000+,
Median costs
Housing units without mortgage Monthly Costs:
<$100, $100-199, $200-299, $300-399, $400+, Median
costs
Housing units with mortgage costs as
percent of Income:
<20%, 20-24.9%, 25-29.9%, 30-34.9%, 35%+
Housing units without mortgage costs as percent of Income:
<10%, 10-14.9%, 15-19.9%, 20-24.9%, 25-29.9%, 30-34.9%, 35%+
Occupied units paying rent:
<$200, $200-299, $300-499, $500-749, $750-999, $1,000-1,499, $1500+, Median
rent, No rent
Occupied units paying rent as
percent of Income:
<15%, 15-19.9%, 20-24.9%, 25-29.9%, 30-34.9%, 35%+
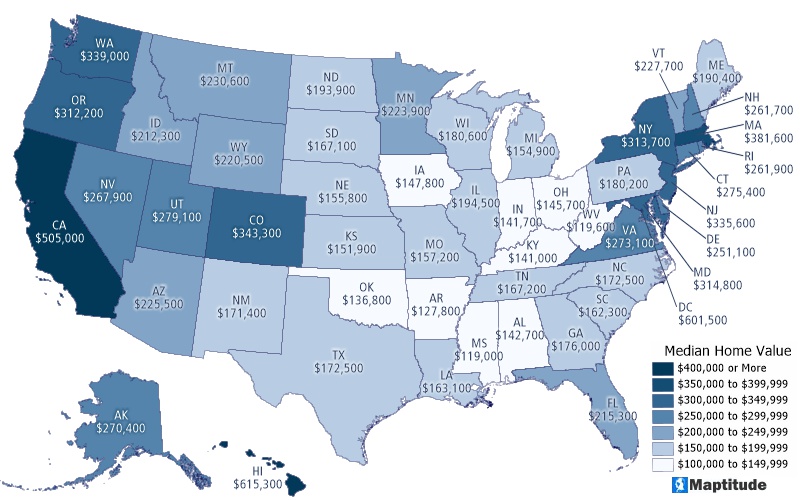
Maptitude makes it easy to explore startling facts such as California, Hawaii, and Washington D.C. having median home values of over $500,000.
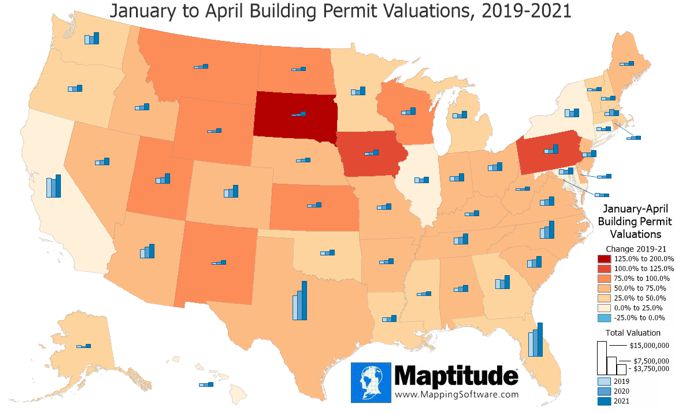
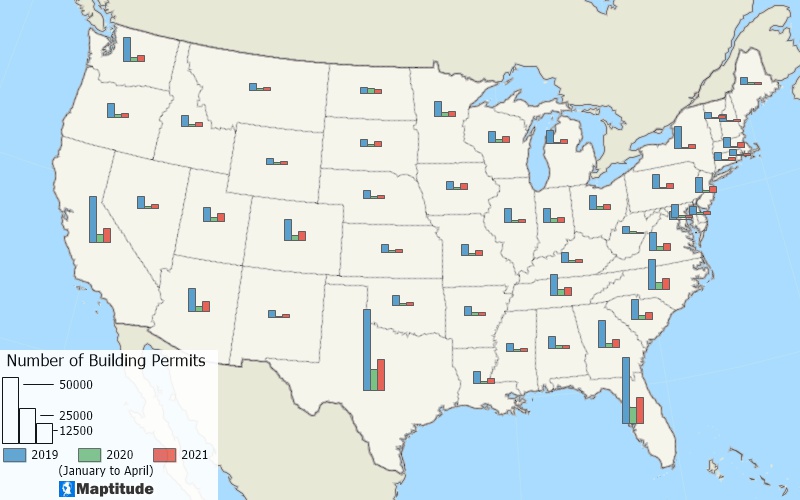
Maptitude can directly map data from the Census Bureau Building Permits Survey. The valuation is the estimated value of the residential structure as shown on the building permit or estimated by the permit official. The data covers building permit statistics on new privately-owned residential construction. Of those properties being built the total valuations are dramatically higher than even 2 years ago.
We map this data using Maptitude to compare the January-April building permit valuations for 2019-2021. Building permit valuations are up from 2019 levels in every state, though down in the District of Columbia (-6.1%). The heat map shows that 31 states had building permit valuations go up at least 50% compared to 2019, and that the valuations more than doubled in South Dakota (177.9%), Iowa (107.7%), and Pennsylvania (101.9%).
The map charts show that 19 states saw a decline in the first four months of 2020 as compared to 2019. Massachusetts saw the largest increase in 2020 despite two months of pandemic and was the only state to see a decline in building permit valuations from 2020 to 2021.
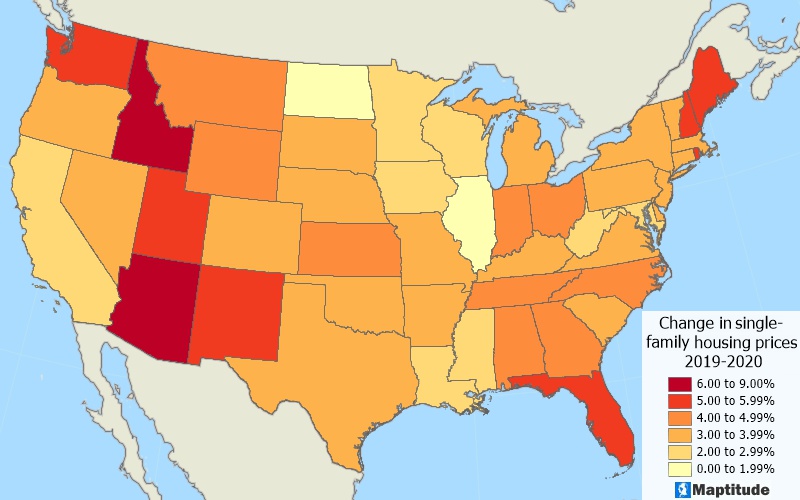
Measuring the percent average change in single-family house prices is possible using the Housing Price Index. This index tracks refinancing or repeat sales for properties with conventional mortgages held by Fannie Mae or Freddie Mac. Maptitude can directly consume such data and produce maps that show that even during the 2020 pandemic most ZIP Codes experienced notable increases in house prices.
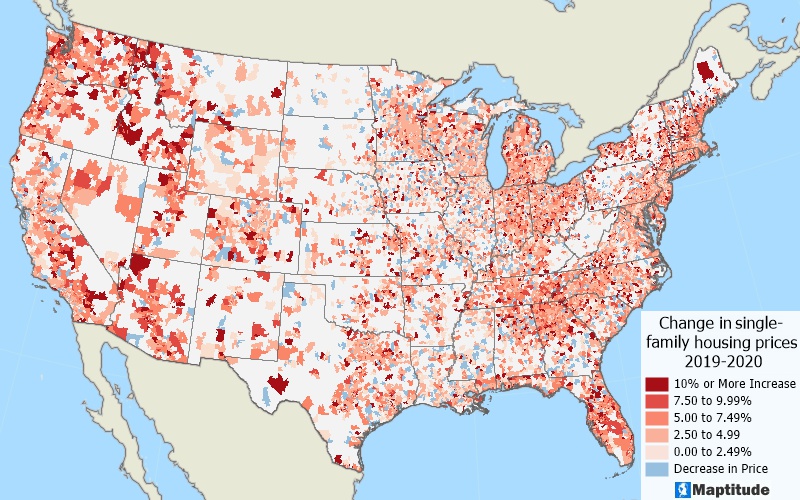
When analyzed nationally, there were no states with negative change in home prices while there were strong increases across the country, especially in the west, northeast, and southeast.
While we have seen that home values and prices are going up, the number of building permits (Census Bureau Building Permits Survey) dropped precipitously for the same period (Jan-April) in 2020 when compared to 2019, and has not bounced back in 2021. Currently, commodity prices are soaring, and land and skilled labor are in limited supply with inflationary pressures growing in the expanding American economy. According to several estimates, home prices will continue to rise through 2023 as development fails to meet demand.
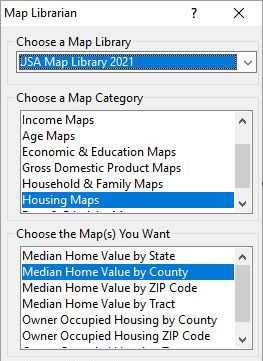 Median Home Value & Owner-Occupied Housing
There are many ways to explore housing data in Maptitude that range from 2D and 3D maps to charts and tables. The easiest way to access the data is simply to browse to Map > Demographic Map Librarian and then choose from the list of maps available for Median Home Value & Owner-Occupied Housing.
Maptitude lowers the burden required for a successful real estate mapping analysis, project, or report. By integrating with key geographic, demographic, and housing datasets, Maptitude provides a one-stop wizard-driven interface. Maps are an intuitive way to convey and analyze large amounts of data. Maptitude can support all the above analytics and can access all the data used in the examples shown, as well as information for almost any industry and sector you would need to map.
Learn more about Maptitude to see how you and your team can access the data critical to making successful real estate decisions!
Schedule a Free Personalized Demo


Home | Products | Contact | Secure Store
