




Author:
Stewart Berry
Images: Dan Martin
26 June 2026
Maptitude Online is a standalone, web-based tool where all map creation and editing happen directly in your browser. There is nothing to install, no desktop license to buy, and no GIS experience required. Sign in from any device, whether Windows, macOS, iOS, or Android, and you are mapping in minutes.
Upload an Excel or CSV file, paste a list of locations, or type addresses, and Maptitude Online turns that data into clear, interactive maps using the step-by-step Create-a-Map Wizard map builder. Every core task, including geocoding, territory building, drive-time analysis, route optimization, and demographic analysis, runs in the browser through guided wizards. For the complete toolset, see the Maptitude Online features and the Maptitude Online FAQ.
When you are ready to share your results, Maptitude Online makes it simple:
Shared maps use stable URLs, so when you update a map the link keeps working and recipients always see the latest version. Multiple people can even edit the same map at the same time, with changes merged automatically.

|
“A picture speaks a thousand words. Being able to create a sales tool in a few clicks is priceless.”
|
In this article:
What can you do when you log in to Maptitude Online?
Maptitude Online is a browser-based mapping and Geographic Information System (GIS) platform built for sales, marketing, and operations teams rather than GIS specialists. Because everything happens in the browser, you create, edit, analyze, and share maps without installing software or managing updates. You can open your maps on any device, at any time, and set administrator and team permissions so the right people can view, query, and download the right maps, data, and reports.
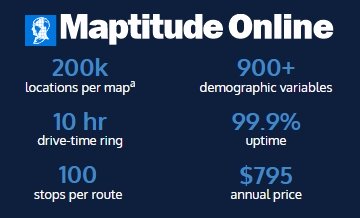
Each subscription includes the data and tools most location projects need: 900+ demographic, Census, and ACS variables, unlimited geocoding, unlimited territories, unlimited drive-time rings up to 10 hours, and unlimited routes with up to 100 stops, all at a fixed annual price of $795. An AI-powered Data Library lets you query those variables in plain English, and an AI support assistant answers product questions at any time. A fully functional 30-day free trial is available with no credit card required.
Maptitude Online runs on its own infrastructure, so geocoding, routing, demographic data, and map tiles are native to the platform and your location data never passes through third-party APIs. WebGL rendering keeps maps fast and responsive at up to 200,000 point locations per map. For the full feature breakdown, see the Maptitude Online FAQ.
When you sign in with your username and password, everything happens in the browser:

|
“Good thematic analysis can be complex, especially in a web interface. This Maptitude powered application does a nice job of making it simple for the user.”
|
Maptitude (the desktop product) is a separate Windows GIS application for in-depth geographic data analysis. It is an intuitive, affordable, one-stop source for sophisticated analysis: quicker and more powerful than most alternatives, able to handle larger datasets, with integrated data and analytics. It includes commercial-grade map features such as streets and postal/ZIP Codes, plus demographics from the Census and a wide array of commercial, governmental, and proprietary sources.
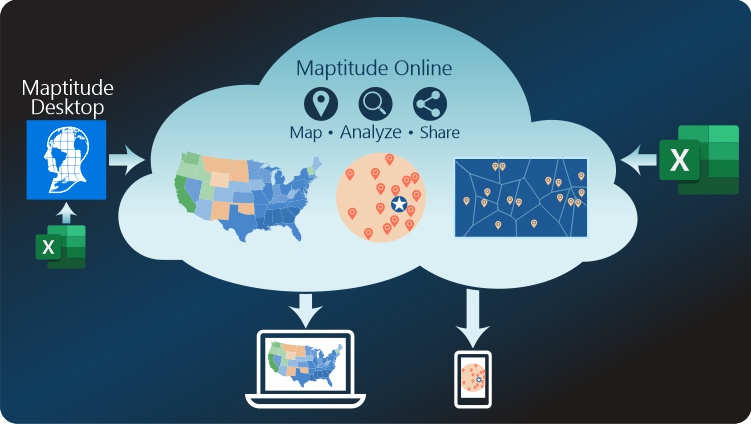
Maptitude Online architecture: your data and desktop Maptitude feed into Maptitude Online, which delivers interactive maps to any device
Desktop Maptitude is a different product from Maptitude Online. You do not need desktop Maptitude to use Maptitude Online, and everything described above happens entirely in the browser. Maptitude Online includes a subset of the desktop analysis features, paired with online sharing, publishing, and collaboration that the desktop product does not provide on its own.
Desktop users do gain one added benefit. Spatial analysis done in desktop Maptitude, including maps, reports, territories, drive-time analyses, and routes, can be published directly to Maptitude Online in a few clicks and shared via a stable URL. No file exports and no third-party tools are required. In short, Maptitude Online stands on its own as a complete browser-based platform, and it also serves as the sharing and publishing destination for teams that already use the desktop product. You can follow this article or video tutorial to see how desktop maps are published online.
You can use desktop Maptitude to map your data globally, or for specific countries, and then publish those maps to Maptitude Online for browser-based viewing and sharing. Maptitude Online supports map backgrounds for the USA, UK, Canada, Australia, New Zealand, Europe, North America, and South America.
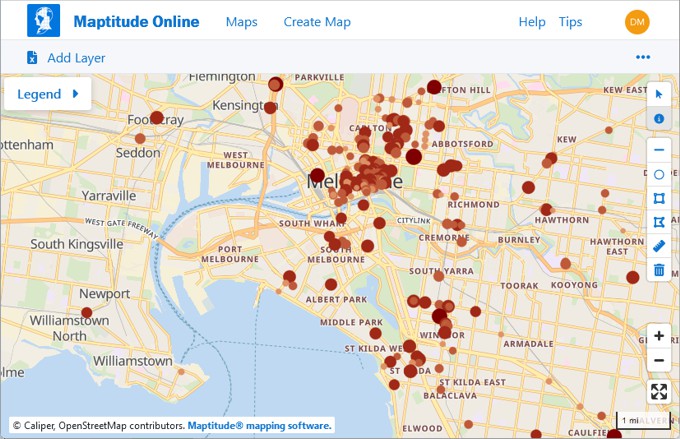
A Maptitude Online map of Australia customers with a sales theme
Businesses use Maptitude Online to map customers and prospects from spreadsheets, build and balance sales territories, analyze trade areas, and share the results with colleagues and clients. Maptitude is used by business development professionals in Fortune 50 companies, healthcare, banking, retail, franchising, restaurant chains, and more, and Maptitude Online lets those organizations share that work widely.
A published map example shows median home value within a 40-minute inbound travel-time ring, with a downloadable PDF report detailing the demographics inside the drive-time buffer. Switching the background to aerial imagery is a standard part of the service.
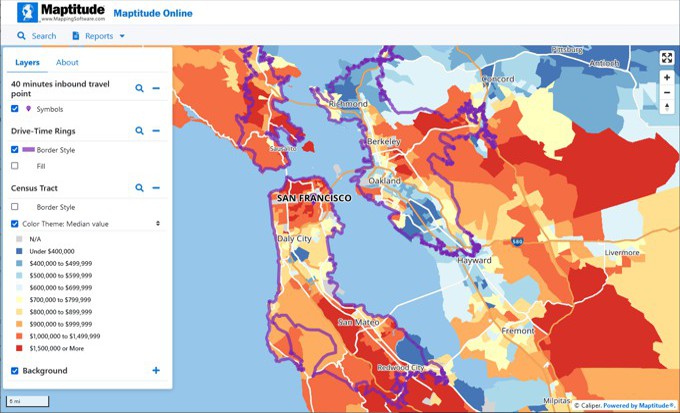
Maptitude Online Map Example: Travel Time with PDF Report - Share your maps online!
GIS is a critical tool in today's banking environment, where competition comes from existing banks, new banks, internet and phone banks, and retail-based incursions into traditional financial markets. GIS also helps banks comply with government requirements. Maptitude includes over 100,000 bank and credit union points-of-interest locations plus the Federal Financial Institutions Examination Council (FFIEC) Census Tract demographics required for compliance under the Home Mortgage Disclosure Act (HMDA), the Community Reinvestment Act (CRA), and for fair and non-discriminatory lending practices.

|
“We've used Maptitude for more than 20 years and have created maps for 600-700 banks with Maptitude. We are very enthusiastic about Maptitude Online. Right now we are publishing maps of interest to the banking industry and have gotten a tremendous response. We've found that even bank regulators are visiting our online maps!”
|
GeoDataVision, a banking compliance consulting firm, collaborates with external partners using Maptitude Online, making it much easier to assess and visualize risk and exposure in real time. The company currently uses Maptitude Online with banks and has published several critical maps for the industry.
This map classifies the minority population percentages (greater than 50%) for every Census Tract in the country using the FFIEC Census Demographics file. "We have used the standard definition of a Majority-Minority Census Tract," said Len Suzio, President of GeoDataVision. “In most cases, regulators include all minorities. However, in some locations, regulators will limit the definition to subsets of the minority population.” The majority-minority map is effective for the whole country because you can zoom anywhere in the United States and determine if a Census Tract is majority-minority.
This map uses color theme to identify Tracts by income class as determined by the FFIEC. This allows banks to see a picture of all the Tracts in and around their Assessment Area, making it easy to recognize the low- and moderate-income neighborhoods.
This map depicts all Metropolitan Statistical Areas (MSAs) in the United States. MSAs are important for CRA purposes because during CRA exams the practice has been to divide Assessment Areas based on MSAs. This more granular approach can result in different performance standards. Therefore, a bank that wants to anticipate how it will do on its CRA exam should break out any Assessment Areas it has defined to include complete MSAs in the Metro Division components.
This map shows CSAs (Combined Statistical Areas) which are an important factor for Assessment Area delineation because the Community Reinvestment Act (CRA) allows banks to extend their Assessment Area beyond MSA borders when the MSA's (or non-MSA areas) are contained in the same CSA. “This is an option that may allow banks that are having difficulty meeting the minimum volume of Assessment Area lending (AA Ratio) to expand their AA and include lending in broader markets”, said Len Suzio, President of GeoDataVision. The CSA map will allow banks to determine if and where they may be allowed to expand their Assessment Areas.
Maptitude Online for Redistricting was first released to support public participation in the 2010 political redistricting cycle and was again used by many government agencies during the 2020 cycle. The Maptitude Online SaaS was first released in 2020. The service is valued because it provides straight-forward publishing tools that allow agencies to easily distribute their findings and results to those that need them within an organization and beyond.
The Maryland Legislative Redistricting Advisory Commission is charged with gathering public input and drawing Maryland's political boundary plans. To support this mission, they chose Maptitude Online to share House, Senate, and Congressional Districts.
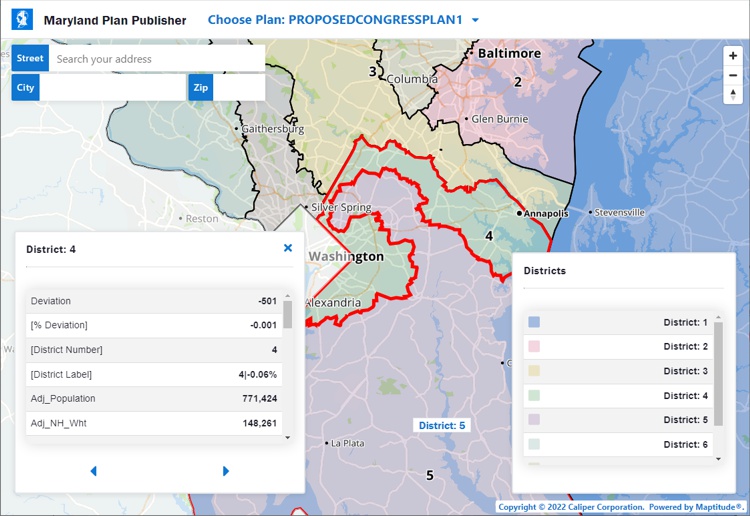
Maryland districts shared as a public Maptitude Online map
STEAP (Screening Tool for Equity Analysis of Projects) is a Federal Highway Administration (FHWA) Maptitude Online web application that permits rapid identification of potential project locations anywhere in the United States. STEAP provides the ability to identify transportation project impacts on marginalized populations based on race, color, national origin, limited English language proficiency, and minority, disadvantaged, and low-income status (Environmental Justice).
STEAP has a simple user interface that allows you to select existing highways or to draw lines of proposed roadways on the map. Maptitude Online then computes the characteristics of the population within the user-selected buffer of the road or corridor. STEAP allows FHWA and state or other local transportation agencies to generate equity analysis project profile reports without the need for GIS specialists to perform the work.
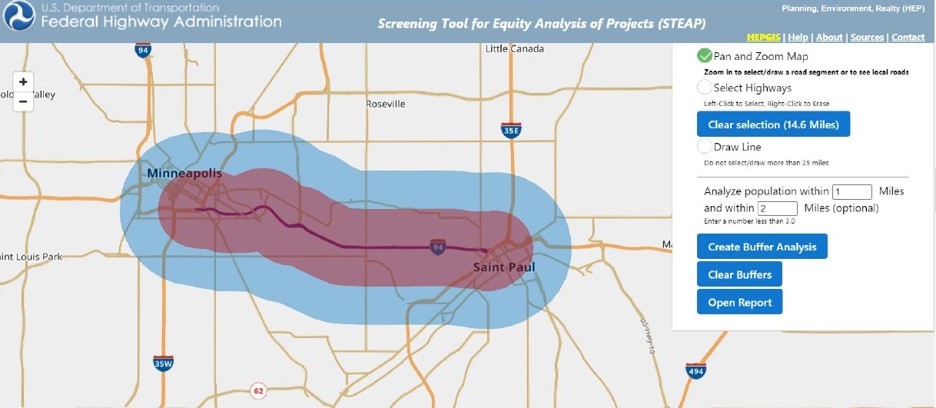
The FHWA STEAP web application, powered by Maptitude Online
“[The] Screening Tool for Equity Analysis of Projects permits rapid screening of project locations anywhere in the US [and has an] easy to use graphic user interface [where] users can specify project locations on the map. [This] no longer require GIS specialists to perform project buffer analysis [and can] generate easy-to-read reports.”
|
Maptitude Online puts complete, browser-based location intelligence in the hands of your whole team, not just GIS specialists, so colleagues, stakeholders, and the public can turn data into decisions and share the results from anywhere. The outcome is faster, better, and more accurate location-based decisions, with no software to install and nothing standing between your team and the map.
Visit us for more information on Maptitude Online to start mapping and sharing in the browser.
Explore the Maptitude Online features to see everything you can do in the browser.
Schedule a Free Personalized Demo

Home | Products | Contact | Secure Store
 Call Us

