Maptitude is the best mapping software for business intelligence! Maptitude allows you to map locations in almost any industry such as coffee shops (quick service restaurants or QSRs). Here we map Dunkin vs Starbucks locations, against consumer expenditure on roasted coffee. Maptitude allows you to explore detailed consumer spending per capita on a huge variety of goods. Using a Maptitude box plot, we see that Dunkin ($64.11) and Starbucks ($67.15) are located in areas with higher spending on roasted coffee in comparison to the national average ($61.60).
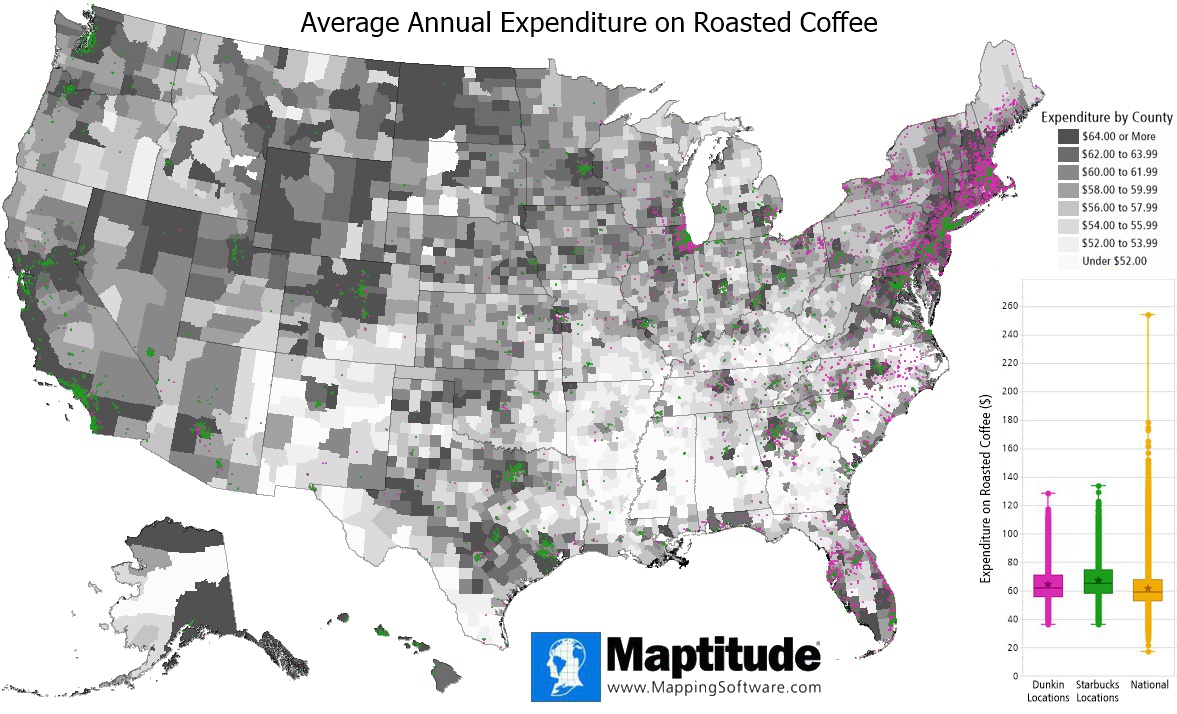
Map: Created with Maptitude Mapping Software by Caliper, June 2020
Home | Products | Contact | Secure Store
