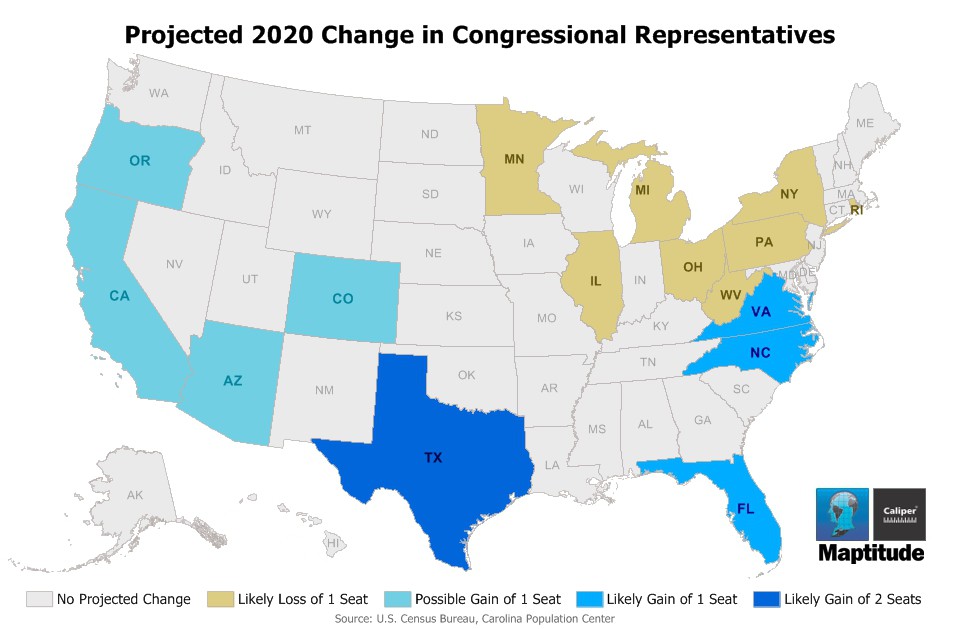
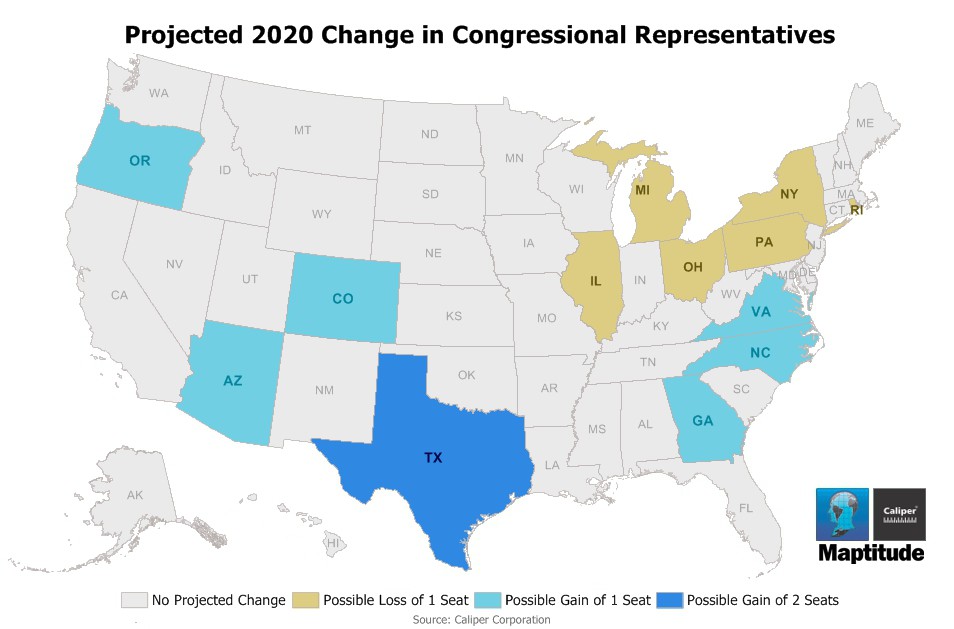
Maptitude is the best mapping software for business intelligence! Every ten years, something momentous happens in U.S. politics: the 435 House of Representative seats are reapportioned among the states based on the change in share of population as reported in the census. The UNC-Chapel Hill's Carolina Population Center used data from a variety of sources to predict the losers and winners by state in the 2020 apportionment (top map). The pattern that emerges is of a shift in power from the northern USA to the south and west. Using the 2020 population projection data included with Maptitude, we were able to verify these projected trends (bottom map).
Map: Created with Maptitude Mapping Software by Caliper, December 2015
Home | Products | Contact | Secure Store
