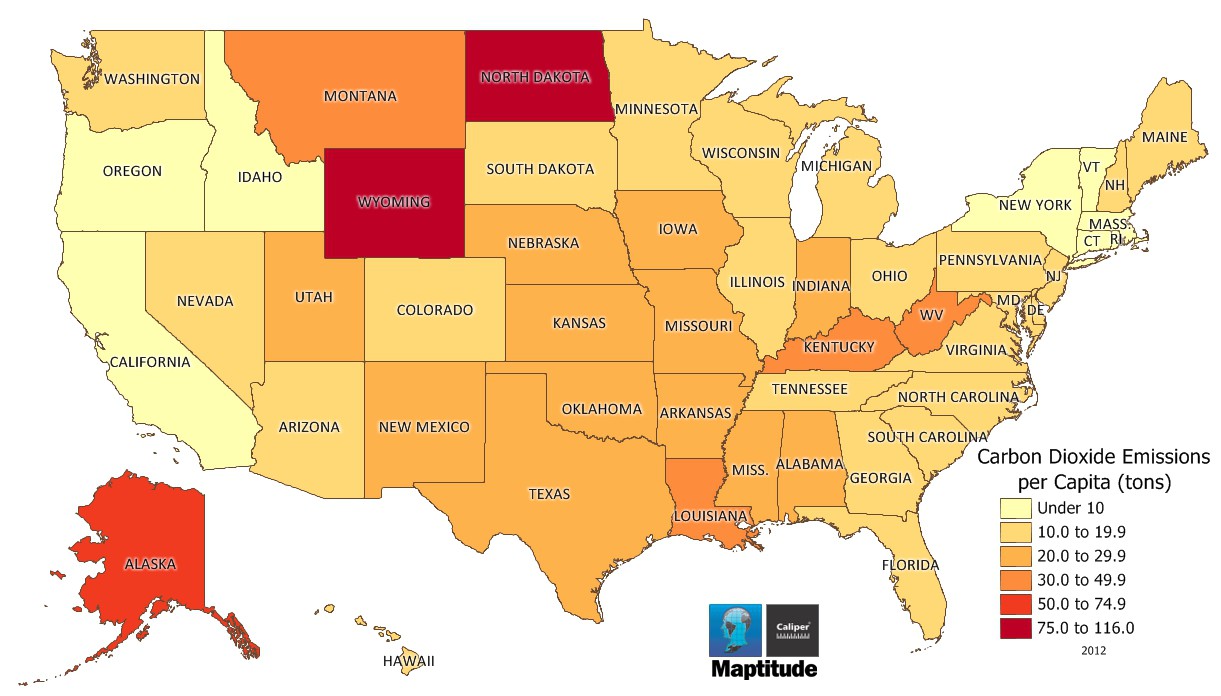
This Maptitude map shows the per capita 2012 carbon dioxide emissions by state in metric tons. The lowest emissions are in the District of Columbia at just 4.8 tons per capita, followed by New York (7.9 tons), Vermont (8.0 tons), Connecticut and Massachusetts (8.9 tons), and California (9.1 tons). By contrast, the low-population energy-producing states have the highest per capita CO2 emissions with Wyoming (115.8 tons), North Dakota (81.2 tons), and Alaska (52.8 tons) topping the list.
If you need a custom map for your story, blog, or website, contact us because we offer a limited number of free custom maps on a first-come, first-served basis! See our Featured Maps for inspiration.
Map: Created with Maptitude Mapping Software by Caliper,
November
2015
Source: US Energy Information Administration
Home | Products | Contact | Secure Store
