
Author: Max Bahar
The Albertsons and Kroger merger announced in October of 2022 has been surrounded in controversy. As a result of the $24.6 billion agreement, Albertsons and Kroger will operate almost 5,000 grocery stores across the United States.1 Experts argue that this merger may decrease overall competition in the grocery store industry.2 However, the geographic distribution of Albertsons and Kroger grocery stores will play a big role in how the merger affects different parts of the country. So, the question arises: "How do we analyze the geographic competition of two grocery chains?"
The scope of this analysis includes the parent and subsidiary brand locations located on the US mainland which excludes Hawaii, Alaska, and US territories.
For Albertsons, this includes Acme Markets, Albertsons, Albertsons Market, Amigos, Andronico's, Balducci's, Carrs, Haggen Food & Pharmacy, Jewel-Osco, Kings Super Markets, Lucky by Albertsons, Market Street, PAK'nSAVE, Pavilions, Randalls, Safeway, Shaw's, Star Market, Tom Thumb, United Supermarkets, and Vons.3
For Kroger, this includes Baker's, City Market, Dillons, Food 4 Less, Foods Co, Fred Meyer, Fry's, Gerbes, Harris Teeter, Jay C, King Soopers, Kroger, Mariano's Fresh Market, Metro Market, Pay Less, Pick 'n Save, QFC, Ralphs, Ruler, and Smith's.4
We use the Business Location layers and the Point of Interest layers for the location data.
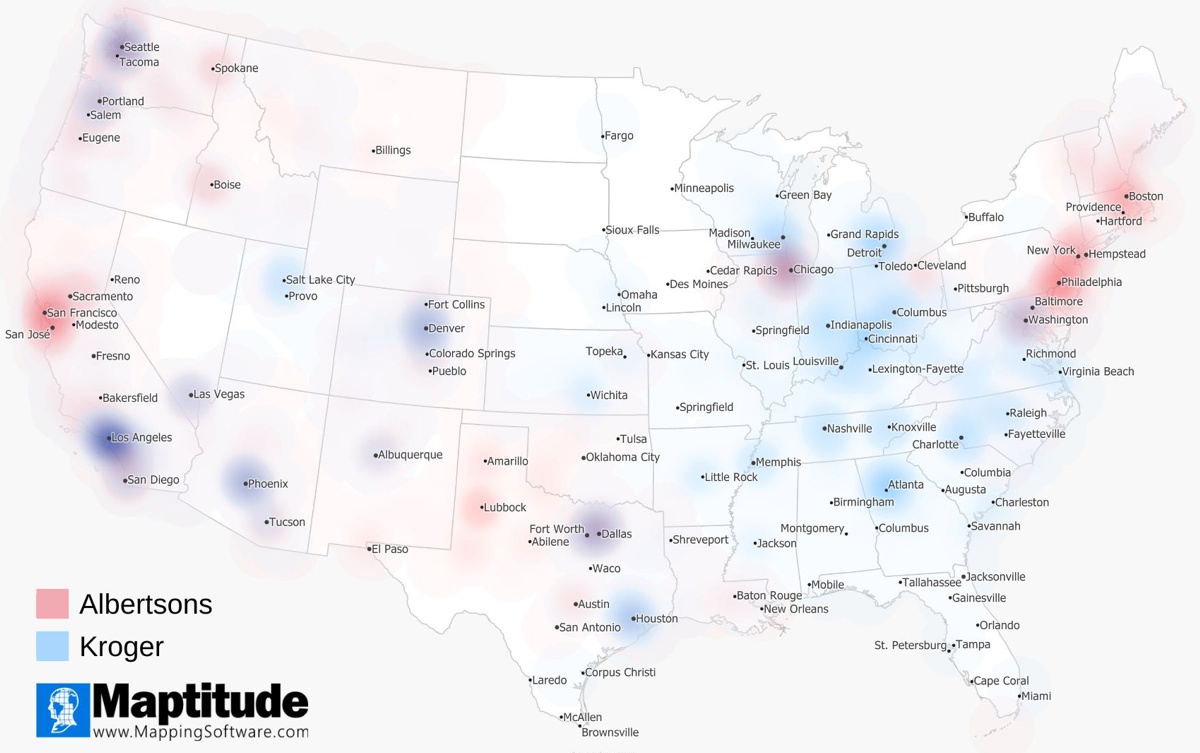
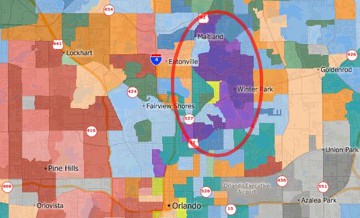
Areas in darker red indicate concentrations of Albertsons (e.g., San Francisco, Philadelphia, Lubbock), areas in darker blue indicate concentrations of Kroger (e.g., Houston, Atlanta, Detroit), and areas in purple indicate where there is overlap between the two stores (e.g., Los Angeles, Dallas, Washington DC).
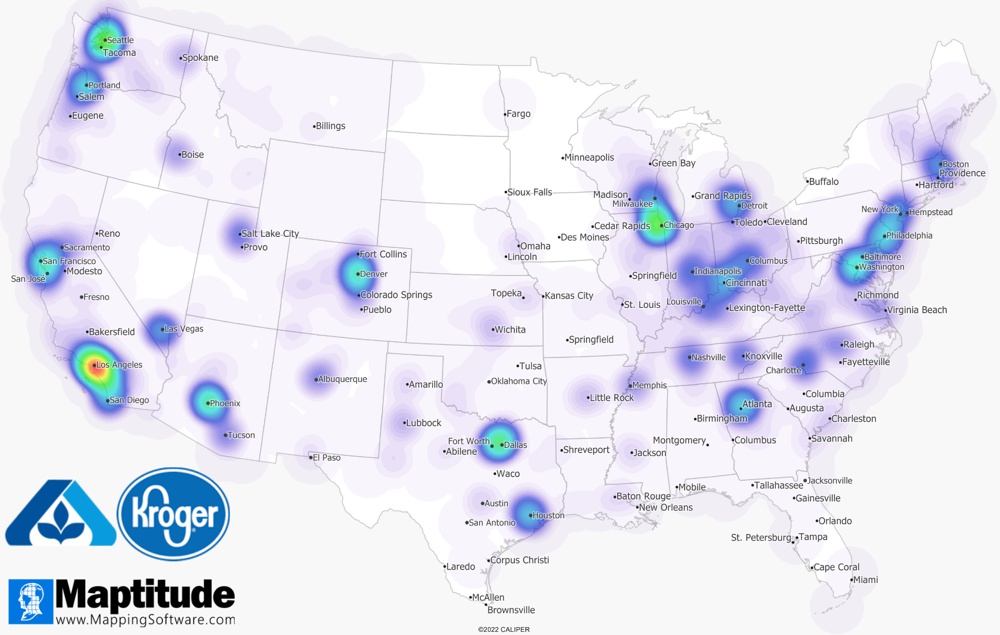
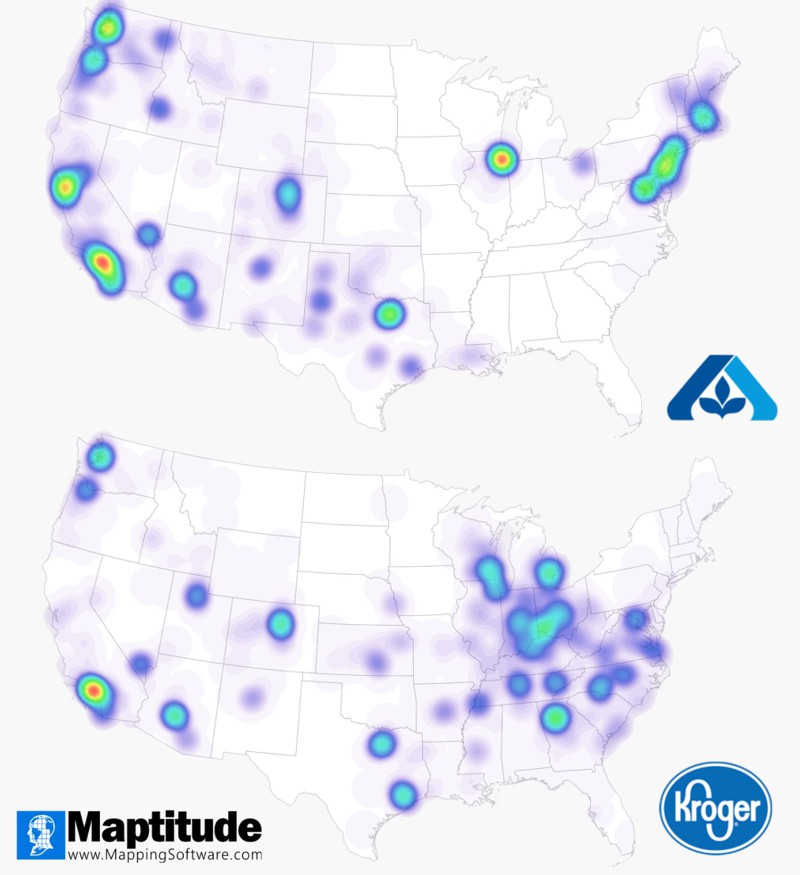
The easiest way to visualize the spread of Albertsons and Kroger locations is to create a heat map. The resulting heat map shows geographic overlap between the two brands in several areas: Seattle, Los Angeles, Denver, Dallas, Chicago, and Washington DC. In these cities, previously competing grocery stores will now be owned by the same company. If we assume that all Albertsons and Kroger grocery stores will remain open after the merger, the market share of Albertsons-Kroger will increase in areas with significant overlap. This may make it more difficult for other grocery stores with smaller market shares in these regions to compete with Albertsons-Kroger. It isn’t clear how likely this outcome is, as regulators may require Albertsons-Kroger to sell or close multiple stores due to antitrust reasons. If Albertsons-Kroger are instructed to sell or close some of their locations, grocery stores in the areas listed above are more likely to be sold or closed than stores in the non-overlapping areas.
The heat map also shows areas where one company has more locations than the other. Specifically, Albertsons has a larger presence in the Northwestern and Northeastern areas of the US compared to Kroger. On the other hand, Kroger has a large footprint in the Southeastern portion of the U.S., while Albertsons does not have any locations there. If we assume that there will be no change in the day-to-day operation of Albertsons-Kroger grocery stores, the market share of Albertsons-Kroger may not change in these areas. However, it is more likely that the expanded size of Albertsons-Kroger will translate to additional investments for these stores, potentially increasing the market share of Albertsons-Kroger in the non-overlapping areas.
In addition to the region-specific impacts of Albertsons and Kroger merger, we can use distance radius and drive-time ring analyses to estimate the overall impact of the merger. Using the 2020 US Census data, we estimate that the population within a 5-mile radius for all Albertsons locations is 121,124,719 (or 36.8% of the total U.S. mainland population), for all Kroger locations is 139,063,238 (or 42.2% of the total U.S. mainland population), and for both Albertsons and Kroger locations is 184,238,217 (or 56.0% of the total U.S. mainland population).
Areas in red are 5 miles or less from an Albertsons location. Areas in blue are 5 miles or less from a Kroger location. Areas in purple are 5 miles or less from an Albertsons or Kroger location. Click here to view an interactive map.
Similarly, we can run a drive-time analysis to estimate the population in a 15-minute drive-time radius for Albertsons and Kroger locations. We find that the estimated population in a 15-minute drive-time area for all Albertsons locations is 124,552,286 (or 37.8% of the total U.S. mainland population), for all Kroger locations is 146,835,469 (or 44.6% of the total U.S. mainland population), and for both Albertsons and Kroger locations is 192,249,913 (or 58.4% of the total U.S. mainland population).
Areas in red are 15 minutes or less from an Albertsons location. Areas in blue are 15 minutes or less from a Kroger location. Areas in purple are 15 minutes or less from an Albertsons or Kroger location.
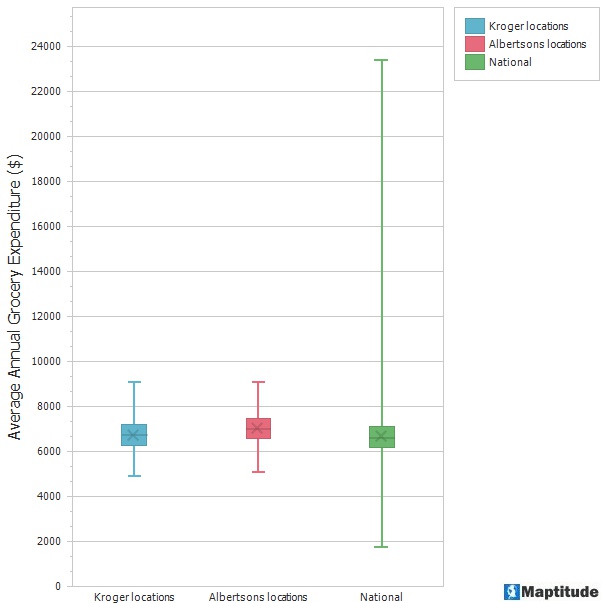
We can use mapping software to analyze the demographics of people living near Albertsons and Kroger grocery stores. Using Consumer Expenditure data, we can estimate the average expenditure for groceries in a 1-mile radius around each of the two brands’ locations. The box plot below shows that, on average, Kroger-owned grocery stores are in areas with lower expenditure on groceries. Specifically, the average expenditure for groceries around Kroger-owned locations is $6,755.46 while the average expenditure for groceries around Albertsons-owned locations is $7,028.07. For reference, the national average expenditure for groceries is $6,670.54, lower than both Kroger’s and Albertsons’ averages.
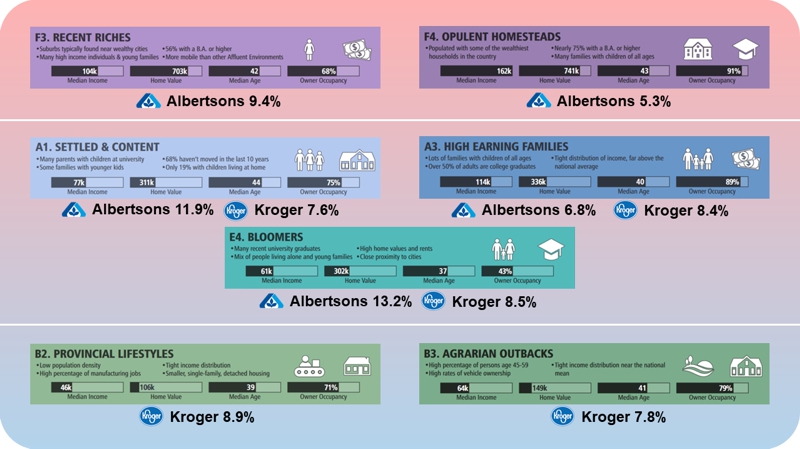
Furthermore, Geodemographic Segmentation data show that Albertsons and Kroger target only some of the same demographic groups. The three demographic groups with the highest overlap of Albertsons and Kroger locations are Settled and Content, High Earning Families, and Bloomers. All three overlapping subsegments are composed of moderate to high-income households whose members have gone to university.The subsegments where Albertsons overtake Kroger are Recent Riches and Opulent Homesteads, both of which are comprised of very wealthy households. On the other hand, Kroger has a higher share than Albertsons in the Provincial Lifestyles and Agrarian Outbacks subsegments, both of which contain households located in rural areas.
Using mapping software, we were able to examine the competition between Albertsons and Kroger in the United States.
By creating a heat map, we determined that Seattle, Los Angeles, Denver, Dallas, Chicago, and Washington DC have significant overlap of Albertsons and Kroger locations. On the other hand, Albertsons overtake Kroger in the Northwestern and Northeastern areas of the US while Kroger prevails over Albertsons in the Southeastern portion of the US.
Using the distance radius analysis, we calculated that 56.0% of the US mainland population are within 5 miles of an Albertsons or Kroger location and 58.4% of the US mainland population are within 15 minutes of driving to an Albertsons or Kroger location.
Leveraging demographic data, we estimated that, on average, people who live close to Albertsons locations spend more on groceries than people who live close to Kroger locations. Average spending on groceries near Albertsons and Kroger locations are higher than the national average.
Additionally, we were able to learn that Albertsons and Kroger locations target only some of the same demographic groups of people. Namely, well-educated households with moderate to high levels of income. Our analysis further revealed that Albertsons stores are in areas with very wealthy households and Kroger stores are in rural parts of the US.
If you are looking to analyze the geographic competition between two brands, consider the Maptitude mapping software. If you are an existing user of the software, you can try a comparative analysis like the one above using the steps outlined in this Maptitude Learning Portal article.
1 Kroger. (2022, October 14). Kroger and Albertsons Companies Announce Definitive Merger Agreement. Kroger.com. Retrieved January 30, 2023, from https://ir.kroger.com/CorporateProfile/press-releases/press-release/2022/Kroger-and-Albertsons-Companies-Announce-Definitive-Merger-Agreement/default.aspx
2 Creswell, Julie. (2023, January 23). Kroger-Albertsons Merger Faces Long Road Before Approval. The New York Times. Retrieved January 30 2023, from https://www.nytimes.com/2023/01/23/business/kroger-albertsons-merger.html
3 Albertsons Companies. (n.d.). About ACI. Albertsonscompanies.com. Retrieved January 30, 2023, from https://www.albertsonscompanies.com/about-aci/overview/default.aspx
4 Kroger. (n.d.). Kroger Family of Companies. Kroger.com. Retrieved January 30, 2023, from https://www.kroger.com/i/kroger-family-of-companies
Learn more about Maptitude to see how you and your team can map grocery market data and demographics!
Schedule a Free Personalized Demo

Home | Products | Contact | Secure Store
