

Authors:
Brett Lucas
and Stewart Berry
This article explores how hotels can be used to measure tourism attractiveness. We do this by establishing the size of the trade area of each community based on the number of lodging opportunities in competing towns. To complete this analysis, we use Maptitude Mapping Software.
A trade area analysis provides a visual picture of the area served by competing locations. For example, you can better see the geography of the "breakpoint" that separates customers going to location "A" versus location "B".
The Huff Model is widely used in spatial analysis for predicting whether a consumer visits a particular location. The probability is determined as a function of distance to other competing sites, taking into consideration the location attractiveness (number of hotels in this example relative to the attractiveness of hotels in other towns).
The Huff Model will help in determining trade areas and whether a consumer will stay in community "A" or community "B" for the night.
A simplifying assumption here is that a community which has many hotels will also be well served with additional choices for restaurants/gas stations that meet the needs of a tourist.
We will be looking at the lodging trade area of Lincoln, Illinois. Lincoln is a town of 13,000 people and is the county seat of Logan County. Lincoln grew up as a community along Route 66 the Mainstreet of America between Chicago and Los Angeles, as well as a passenger train stop along Gulf, Mobile & Ohio Railroad between Chicago and St. Louis.
Today, Lincoln is served by I-55, as it is situated halfway between Bloomington/Normal and Springfield (32 and 34 miles respectively), as well as being served by four daily Amtrak trains.
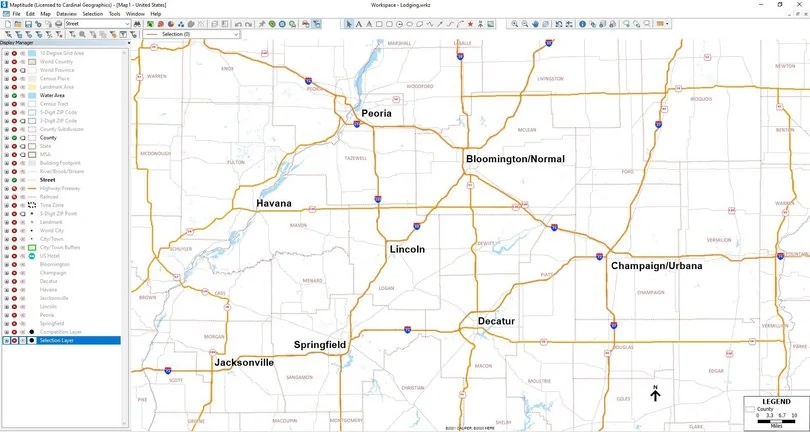
Map 1 – Maptitude Workspace – Study Area
There are a couple of ways to determine the size of the hotel market:
For this example, we chose option 1A and will count of the number of lodging establishments. The count will be used when weighting the Huff Model later in this example. The communities to be considered in this analysis are Bloomington/Normal, Champaign/Urbana, Decatur, Havana, Jacksonville, Lincoln, Peoria, and Springfield.
The first step in gathering the data is to map the Maptitude Hotel layer, available for free by following these steps in this article about accessing the hotel GIS layer.
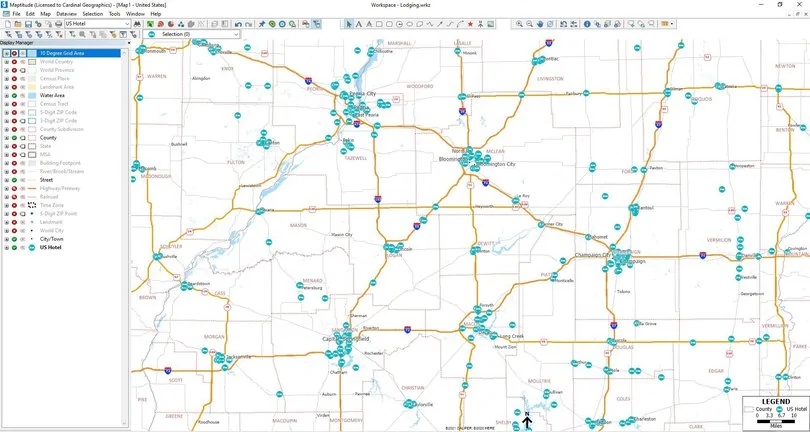
Map 2 – Maptitude Workspace – Hotel Layer
The next step is to select the towns that we will be creating areas around, to count the number of hotels.
To do this, make the "City/Town" layer the working layer, and create a selection set based on the following communities: Bloomington, Champaign, Decatur, Havana, Jacksonville, Lincoln, Peoria, and Springfield
Alternatively, we could create a spreadsheet of the 8 communities and geocode them (Figure 1).
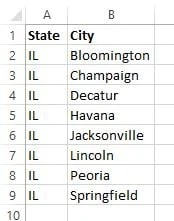
Figure 1 – City/State Spreadsheet
Next, using the Buffers tool, create 10-mile rings around each of the eight selected communities. Be sure to choose "Separate Buffers" to individually create circles around each location. We could just as easily have used drive-time rings rather than as-the-crow-flies straight line distance rings.
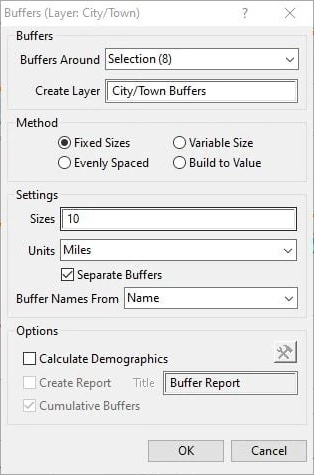
Figure 2 – Buffer window in Maptitude
Before you click OK, choose to "Calculate Demographics" and click on the Configuration button. Choose the "Demographics Settings" as follows to calculate the hotel counts:
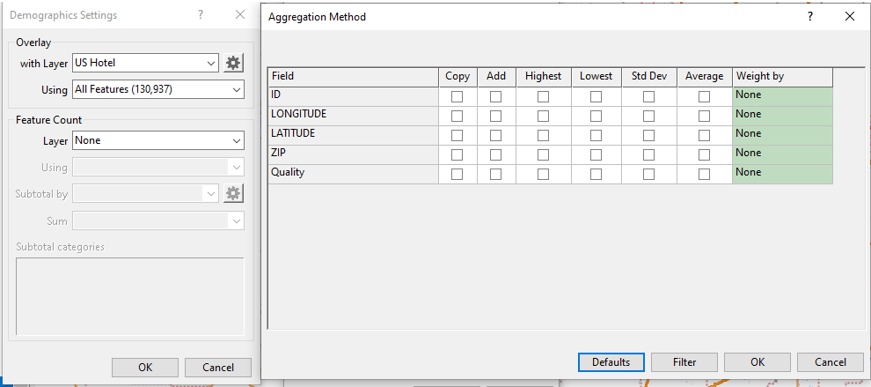
Figure 3 - Demographic settings
Once you have created the buffers the map will look like this:
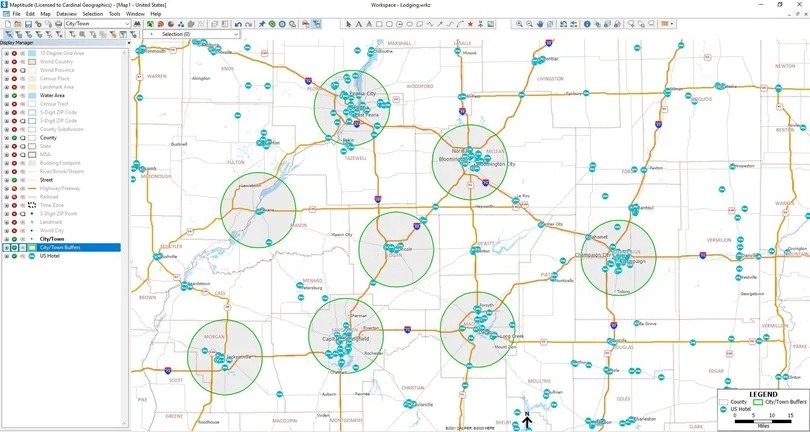
Map 3 – Maptitude Workspace – Hotel layer and 10-mile buffers
And the Dataview will look like this, e.g., with Peoria having 79 hotels and Havana with 4:
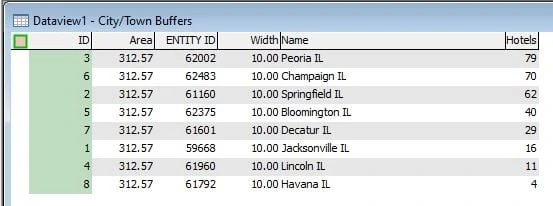
Figure 4 – Dataview with the hotel count aggregated
The Huff Model cannot use an area/polygon layer such as City/Town Buffers. We need to first convert the buffers to points:
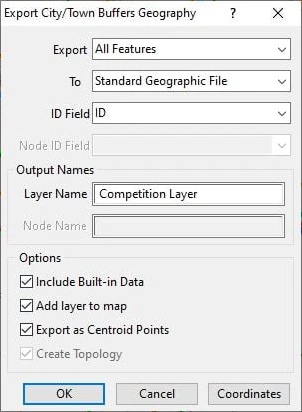
Figure 5 – the export GUI in Maptitude
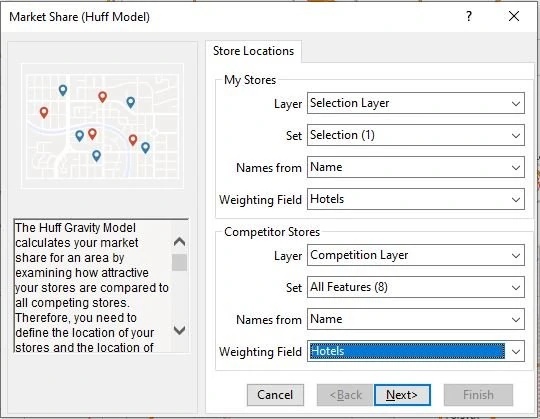
The Market Share Wizard uses a Huff Gravity Model to calculate the market share for an area by examining how attractive stores are compared to all competing stores. The Market Share Wizard requires a point layer with your locations and a separate point layer with your competitors. Both layers require a "name" field to identify the stores, and can optionally include a weighting field (e.g., number of locations).
Before proceeding further, hide the layers "City/Town Buffers" and "US Hotel" to remove some of the clutter in the map.
We will run the Huff Model eight times, once for each community (Bloomington, Champaign, Decatur, Havana, Jacksonville, Lincoln, Peoria, and Springfield).
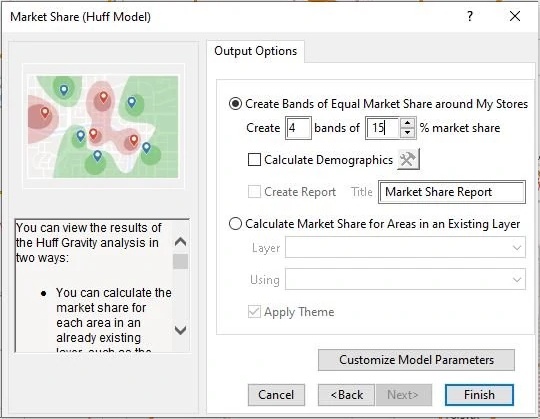
Once the model has finished, the Maptitude Workspace will look like Map 4, showing the "attractiveness" of Bloomington based on the number of lodging establishments.
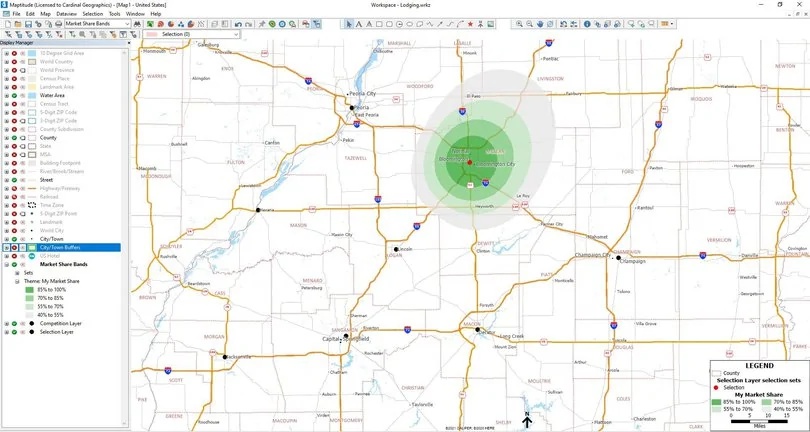
Map 4 – Maptitude Workspace – Showing the Trade Area for Bloomington
Before proceeding further, in the Display Manager right-click to rename the layer "Market Share Bands" and to rename the "Theme" entry to both be "Bloomington." This allows you to differentiate between each trade area. You will want to do this for each subsequent market share layer you create.
Next, make "Selection Layer" the working layer. Using the "Select by Pointing Tool" de-select Bloomington and select Champaign. Now, repeat the steps that were used to create the Bloomington market share layer for each of Champaign, Decatur, Havana, Jacksonville, Lincoln, Peoria, and Springfield.
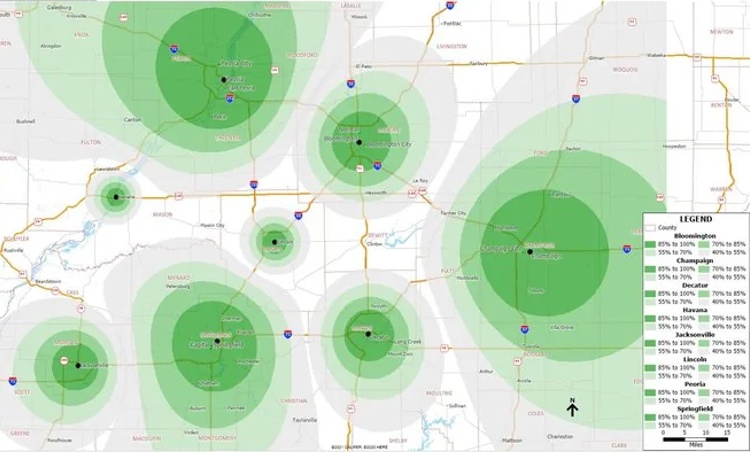
The final Workspace will look like Map 5. Based on the number of lodging establishments, Champaign/Urbana (University of Illinois), Peoria (Caterpillar), and Springfield (State Capitol), have the strongest draw for lodging. The next tier down is Bloomington/Normal (State Farm Insurance, Illinois State University), Decatur, and Jacksonville (Illinois College), which have a medium draw for lodging. The final tier is for Havana and Lincoln, which have the smallest draw for lodging.

Map 5 – Maptitude Workspace – Showing the Trade Area for all eight communities
The Market Share/Huff Model is an extremely useful tool for analyzing current trade areas and for exploring changes based on varying assumptions. For example, let’s say that Lincoln built two more hotels. How would that change the trade area of Lincoln in relation to Bloomington, Peoria, and Springfield? The Market Share/Huff Model can also be used to calculate demographics or other socioeconomic indicator data for each trade area.
To take the lodging analysis to the next level you could expand the attractiveness attributes used. Additional characteristics that may attract customers could be the number of rooms in the establishment, the quality of the establishment (e.g., economy, mid-range, boutique, conference, or luxury), age of the establishment, date of the last remodel, or any other amenities worth rating. You would convert these variables into a score for each hotel, which can then be used as the "weighting field" in the Market Share/Huff Model.
Have fun exploring other market share scenarios with this tool in Maptitude!
Learn more about Maptitude to see how you and your team can benefit from mapping software!
Schedule a Free Personalized Demo
Home | Products | Contact | Secure Store
