

Authors:
Brett Lucas
and Stewart Berry
Choosing the right location for a new convenience store or distribution center can determine whether a business thrives or struggles. Geographic Information Systems (GIS) software transforms raw location data into actionable insights, helping retailers visualize customer reach, analyze competitor positioning, and optimize supply chain logistics. This step-by-step guide demonstrates how to use Maptitude mapping software to perform drive-time analysis, trade area mapping, and distribution network optimization for convenience store (c-store) expansion.
GIS allows businesses to manipulate, analyze, and present data in a geographic context. For retailers and supply chain professionals, this means transforming spreadsheets full of addresses into visual maps that reveal patterns invisible in raw data.
Retail site selection with GIS helps executives, analysts, and planners accomplish critical tasks: analyzing population density and growth patterns, identifying underserved markets ripe for expansion, evaluating how proposed locations affect transportation networks and service areas, and determining optimal distribution center placement to minimize delivery times and costs.
Organizations across real estate, market analysis, logistics, and operations leverage geospatial intelligence to improve decision-making, reduce risk, and align strategies with evolving market conditions.
A trade area analysis provides a visual representation of which stores a particular distribution center (DC) serves. This analysis reveals whether a DC is overextended, serving too many locations, or positioned inefficiently relative to outlying stores, which creates unnecessary transportation costs.
Understanding your trade areas helps answer questions like: How far can delivery trucks realistically travel and return within federal drive-time regulations? Which stores should be reassigned when opening a new DC? Where do opportunities exist for market expansion without straining logistics?
This tutorial uses Kwik Trip/Kwik Star, a gas station and convenience store chain headquartered in La Crosse, Wisconsin, as a real-world case study. While Kwik Trip started in western Wisconsin with high store concentration in Wisconsin and Minnesota, the chain has expanded into Illinois, Iowa, Michigan, North Dakota, and South Dakota. Historically, Kwik Trip relied on a single DC in La Crosse to serve over 875 locations. With increased growth and extended travel times, a second DC opened in November 2025 in Windsor, Wisconsin.
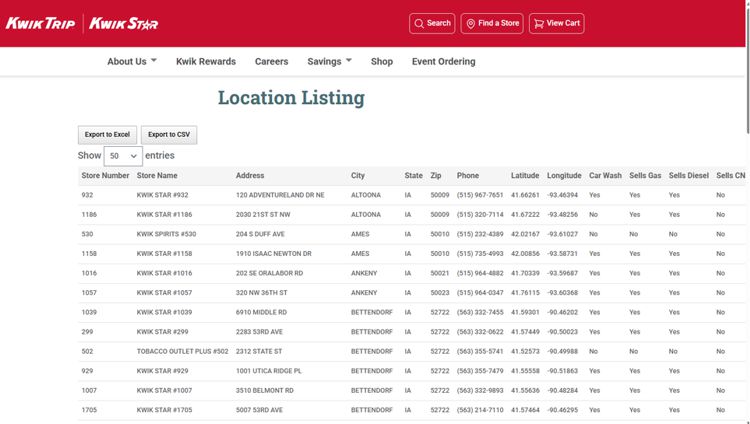
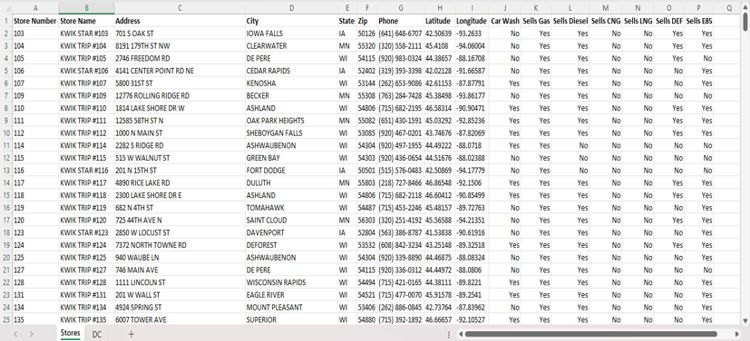
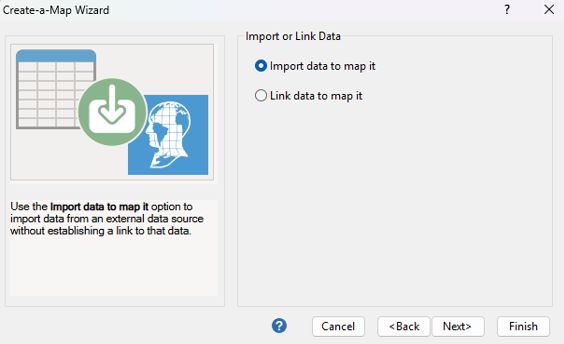
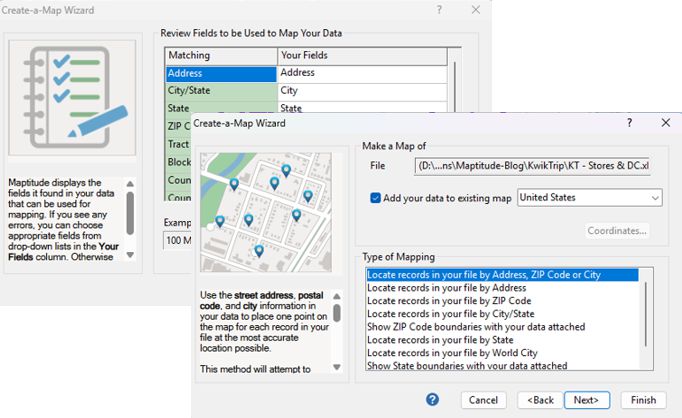
Store location data for this analysis comes directly from the Kwik Trip/Kwik Star website. Alternatively, you can import business location data from the Maptitude built-in layers or create a spreadsheet manually using addresses from Google Maps or similar sources.
| State | City | Address | ZIP Code | Year Open |
|---|---|---|---|---|
| WI | La Crosse | 2025 Kwik Trip Way | 54603 | 1973 |
| WI | Windsor | 6058 Pepsi Way | 53598 | 2025 |
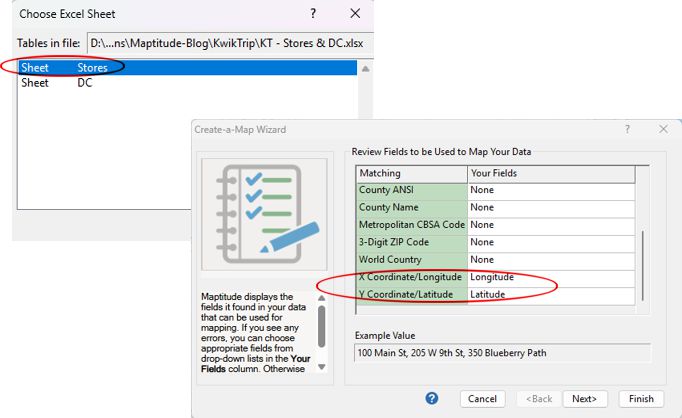
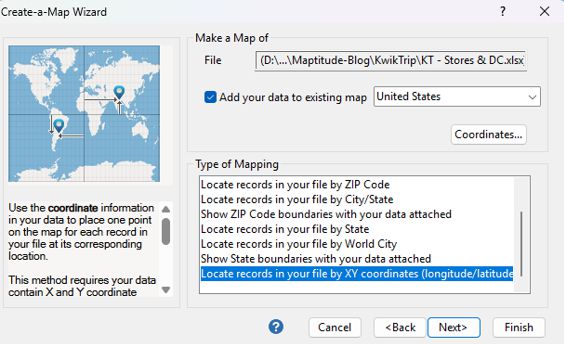
Once you geocode the DC layer, your map will display both layers: the Store layer and the DC layer.
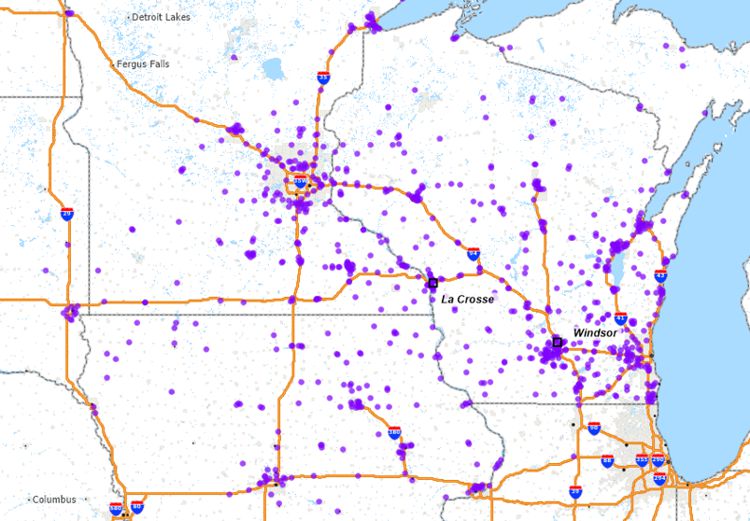
Pause here and examine the map. Do you see any interesting patterns in terms of the store network? Any markets that are overserved or underserved? How about the Minneapolis area in terms of downtown and the outer suburbs? Do you see any limitations in terms of travel time for trucks to deliver merchandise to more remote markets?
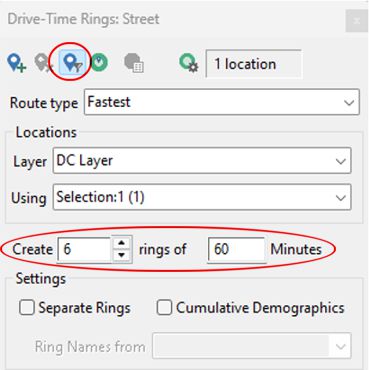
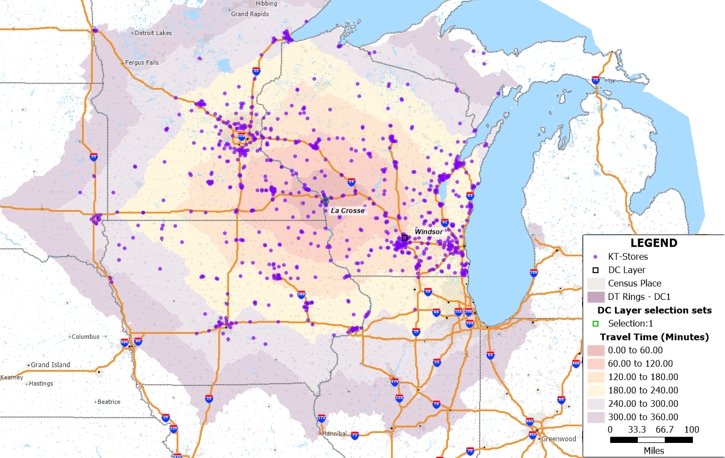
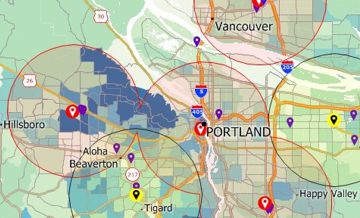
Drive-time rings show how far a vehicle can travel from a starting point within specific time intervals, accounting for road networks and realistic travel speeds. For distribution planning, this helps determine which stores a DC can efficiently serve while complying with federal regulations on driver hours.
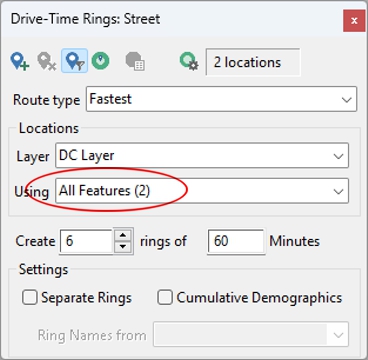
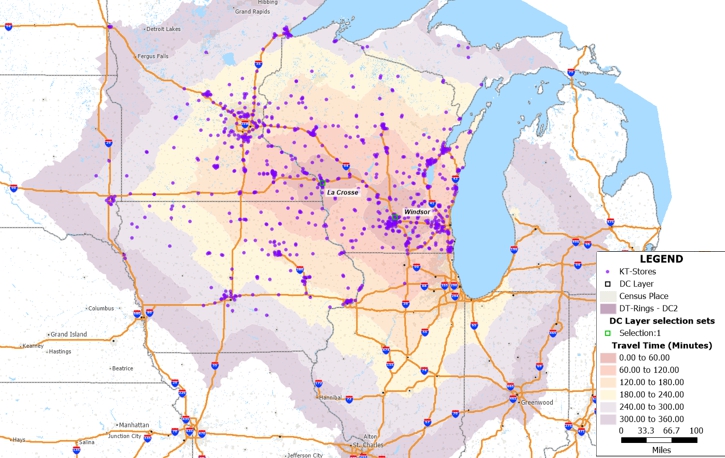
With both DCs mapped, you can evaluate expansion opportunities and identify coverage gaps. Does the new Windsor DC location make sense given the existing store network and planned western expansion?
Manually determining which of 875+ stores should be served by which DC would take hours. The Maptitude tagging feature automates this assignment in minutes.

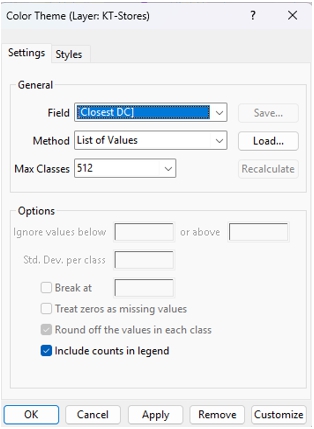
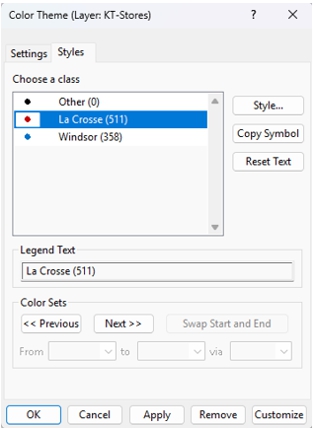
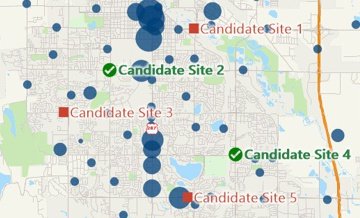
The resulting map color-codes each store by its assigned distribution center, instantly revealing the geographic split between La Crosse and Windsor service territories. This visualization helps answer questions about DC capacity, expansion direction, and market saturation.
For example, Kwik Trip's expansion into Fargo, North Dakota places stores approximately six hours from La Crosse, meaning semi-trucks may require overnight stays before returning.

Drive-time rings represent geographic areas showing how far someone can travel from a starting point within a specific time frame, factoring in road networks, water bodies, and traffic conditions. Combined with store and DC data, drive-time analysis becomes a powerful tool for identifying growth opportunities and logistics constraints.
This type of analysis helps retailers evaluate market penetration and saturation, identify stores requiring reassignment to new distribution centers, plan expansion into underserved territories, and optimize delivery routing to reduce costs and driver fatigue.
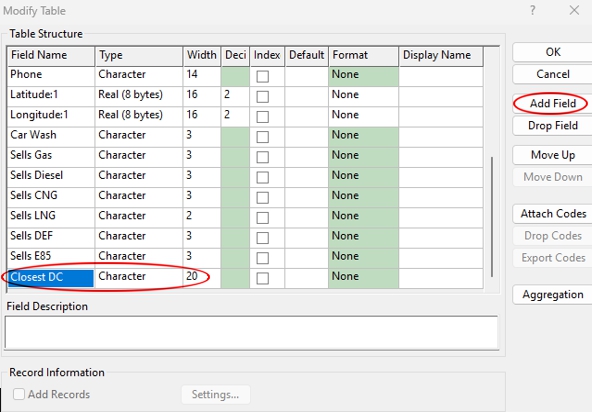
To build on this analysis, businesses can incorporate measures of store attractiveness into their expansion models. Attributes that influence customer appeal include: number of fuel pumps, store square footage, presence of a car wash, facility age, date of last remodel, and available amenities.
These attributes can be converted into a scoring system and used as weighting fields in models like the Market Share/Huff Model, enabling more precise and data-driven expansion strategies.
Drive-time analysis calculates the geographic area reachable from a location within specific time intervals using actual road networks and realistic travel speeds. Unlike simple radius circles, drive-time rings account for highway access, road density, and natural barriers like rivers. Retailers use drive-time analysis to understand customer accessibility, plan delivery routes, and optimize distribution center coverage.
Use GIS software to create drive-time rings from each potential DC location, then overlay your store network to see coverage. Calculate which stores fall within efficient delivery range (typically matching federal driver hour regulations) and identify gaps or overlaps. The optimal configuration minimizes total travel time while ensuring all stores receive timely deliveries.
At minimum, you need store addresses (or latitude/longitude coordinates) and distribution center locations. For more sophisticated analysis, include demographic data, competitor locations, traffic patterns, and store performance metrics. Maptitude includes built-in demographic and business data to enrich your analysis without additional purchases.
Yes. GIS software like Maptitude helps franchisors define exclusive territories, ensure adequate market coverage without cannibalization, and provide franchisees with market intelligence about their service areas. Drive-time territories and demographic analysis are essential tools for franchise territory mapping.
Trade areas should be reassessed whenever significant changes occur: new store openings, competitor entries or exits, population shifts, road network changes, or distribution center relocations. Many organizations review their trade area analysis annually or quarterly as part of strategic planning cycles.
Maptitude mapping software provides the tools, maps, and demographic data you need to analyze your retail network and make data-driven expansion decisions. Whether you're evaluating a single new location or optimizing an entire distribution network, Maptitude offers desktop and online mapping capabilities to support your business intelligence needs.
Request a free trial to explore these capabilities with your own data.
Learn more about Maptitude to see how you and your team can benefit from mapping software!
Schedule a Free Personalized Demo
Home | Products | Contact | Secure Store
