New U.S. data sets provide access to up-to-date geographic information. Maptitude now includes an October 2011 NAVTEQ® map, allowing accurate address locating and street visualization, plus robust data on which to calculate shortest paths, drive-time rings, and network partitions.
![]() Other
2011 U.S. layers
from NAVTEQ® include building footprints for many urban locations,
highways, railroads, and landmarks. The Points of Interest
layer contains over 2 million named locations that range from public
facilities to commercial buildings including shops, restaurants, and
retail stores.
Other
2011 U.S. layers
from NAVTEQ® include building footprints for many urban locations,
highways, railroads, and landmarks. The Points of Interest
layer contains over 2 million named locations that range from public
facilities to commercial buildings including shops, restaurants, and
retail stores.
Maptitude also ships with the October 2011 ZIP Code updates ensuring that you are using the latest data. The 5-digit ZIP Code boundaries are a nationwide area database with ZIP Codes for all 50 states, the District of Columbia, Puerto Rico, and the territories. There is an updated point database of ZIP Code centroids for the entire country and 3-digit ZIP Code areas. The ZIP Code area layers now extend into non-deliverable areas, providing complete coverage of the continental U.S.
All of the US Census boundaries (e.g., tracts, counties, county subdivisions) that are included with Maptitude, plus 3- and 5-digit ZIP Code areas, contain several demographic profiles based on the data reported in the 2010 Census and the 2009 American Community Survey.
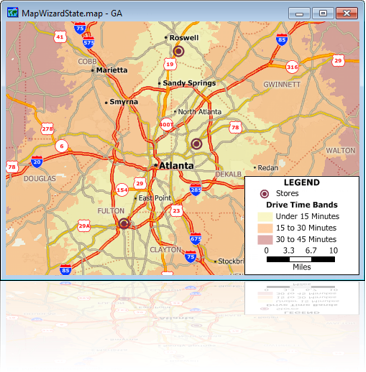
The Network Bands tool has been completely overhauled and is now a simple toolbox that provides the most accurate drive-time ring analysis on the market. There is a default layer (Census Tracts) for calculating demographics for the drive-time rings, as well as default Census fields and aggregation methods.
In addition to creating drive-time rings around records in a point layer, origins can be added by simply clicking on the map. Also, drive-time rings can be recalculated without the need to save them each time the tool is run.
The drive-time rings that are produced by Maptitude are the most accurate of any mapping software, and take into account individual streets in the calculations of those locations that can be reached within the time specified.
There is a revamped shortest path toolbox with several enhancements:
Maptitude 2012 supports enhanced map styling and display features including:
Maptitude 2012 builds upon the major changes to labeling in Maptitude 6.0 with refinements that permit you to:
Geotagging refers to the attaching of geographic coordinate information to images, video, and other media recorded by smartphones or GPS-enabled electronic devices. Maptitude reads geotags from images and creates points in a geographic file based on the coordinate information in the images. Fields in the geographic file are populated with the image file name and other location information read from the geotags.
Regression and binary logit models can be estimated on any map layer or table. You can choose to estimate the model parameters using all of the records in the layer or dataview, or only those records in a selection set filter.
The model estimation procedure creates two output files:
To use the model evaluation tool, you choose the subset of records to be evaluated and the field that will receive the predicted dependent variable. You can also choose the fields that contain the values of the independent variables and make adjustments to the model parameters. The tool will calculate the new value based on the model type (regression or binary logit) and the parameters stored in the model file, and will fill in the designated field.
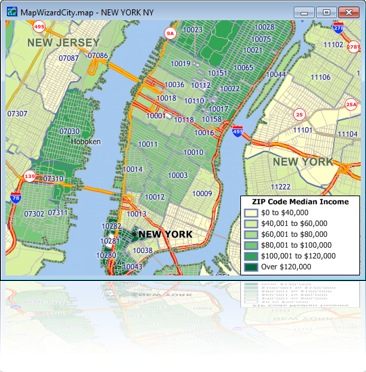
Create-a-Map Wizard™ is now more robust and easier to use. When you need to map your own data, in addition to Maptitude auto-detecting the best fields to achieve this, you can explicitly choose and correct the fields used to geocode or to join your tabular information in order to visualize it in a map. Maptitude also suggests output file names based on your input table.
The Create-a-Map Wizard maps are all revised. The maps use the latest geography and also take advantage of the new features in Maptitude including new label and style options.
The Map Librarian makes it easy to access a series of pre-defined thematic visualizations of Census demographics. A new map library comes with Maptitude 2012 to help you get started exploring 2010 Census data for the USA. The new maps cover US ZIP Codes, Census Tracts, Counties, and States for several demographic profiles based on the data reported in the 2010 Census and the 2009 American Community Survey.
Click here to see
features that were new to Version 6.0.
Home | Products | Contact | Secure Store
