GIS for Local Government: Planning/Zoning


Authors:
Brett Lucas
and Stewart Berry

Introduction
This article explores how to use
GIS in local or Municipal Government. Many local governments are
being asked to have a more transparent relationship with their
citizens, which has been supported by technologies like
geographic information systems (GIS) and other data
visualization tools which allows communities to manipulate, analyze,
and present data in a geographic form. GIS as a tool, can help local
government decision-makers, policymakers, and others visualize data
for a variety of applications.
This could include:
- Analyze land use patterns, assess population growth and density, and
identify development trends.
- Create maps to visualize and
monitor changes in land use, infrastructure, and services.
- Identify potential areas for new development and redevelopment.
- Examine how proposed developments might affect surrounding
areas.
As a local government, utilizing GIS can help you better
communicate that data through a visual component. Many local
governments have found ways to leverage geospatial data across an
organization in areas like building permit inspections, code
enforcement, and street repair.
GIS Software for Government
Maptitude mapping software is an ideal software platform for
local governments (especially smaller municipalities on a tight
budget at only $795) to leverage geospatial data across an
organization. Maptitude is a full featured desktop or online GIS and
mapping software that gives you the tools, maps, and demographic
data to analyze and understand how geography affects you and your
community.
In this article we will demonstrate an application of
Maptitude in the municipal government sector for land use planning
and zoning.
Try an interactive local government zoning map now!
Create your own maps! Try the full-featured version of Maptitude with a
1-month risk-free trial. No credit card is required
Land Use Planning & Zoning – How to create a Zoning Layer
For this example, we will be using the City of Cheney,
Washington. Cheney is a college town of 12,600 people located
approximately 15 miles southwest of Spokane. One of the features
that makes Maptitude so ideal for this task, is that when one uses
the United States Country Package, a boundary file for the city
limits (Census Place) is included, which makes for a great beginning
point for creating a zoning layer.
-
Download a free mapping software trial of Maptitude Desktop
or use your existing Maptitude Desktop license.
- Start Maptitude, and select “New Map of the United States,”
select “US City,” and select Cheney, WA. A map zoomed into
Cheney Washington should appear on the desktop.
- Bring in building footprint data (available from Maptitude
as a free add-on layer), and a parcel layer (in this particular
example, a shapefile that was available from
Spokane County
public data portal). To bring in a new layer, click on the
“Map Layers” icon in the toolbar. Click on “Add Layer,” to bring
in a geospatial layer (point, line, or polygon) such as a
shapefile. Other
spatial file types are supported as well.
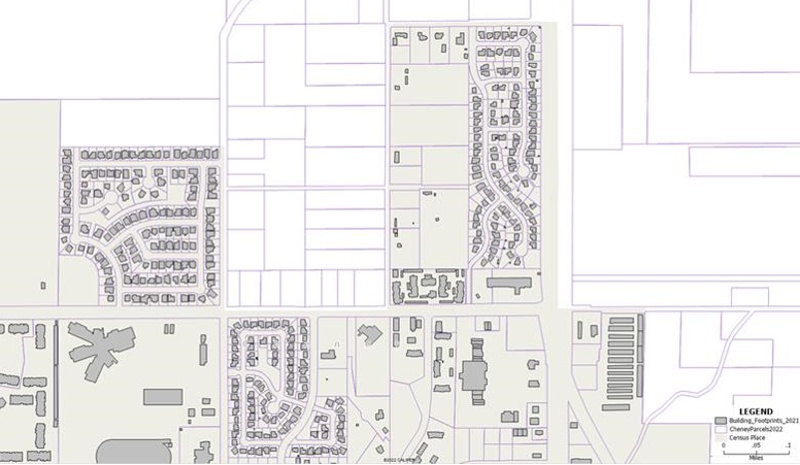
- With the Census Place layer as your working layer, create a
selection set (select your city of interest) and export that
selection out as a “Standard Geographic File,” so it is
editable. When you export out the layer, name it “Zoning Layer.”
Add that layer to the map. At this point, your map should look
something like the map shown in Map 1.
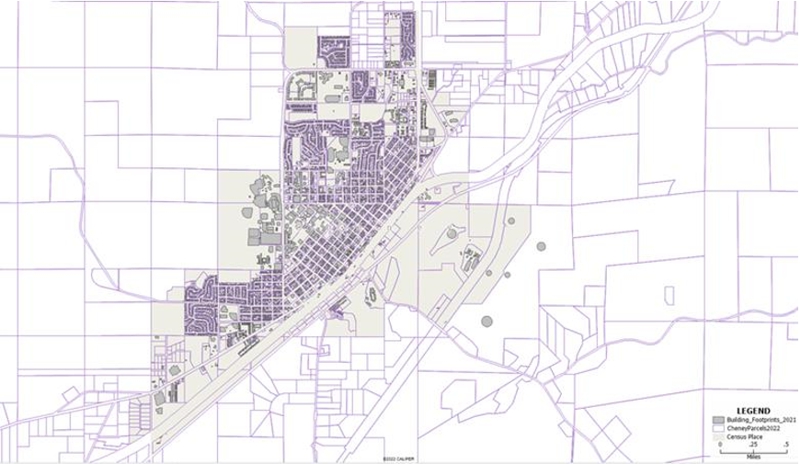
Map 1 – Maptitude Workspace – Study Area.
- Next, you may want to turn on
some aerial photography (three choices available in Maptitude)
to aid in creating a zoning layer. At this point, zoom into your
area of interest.
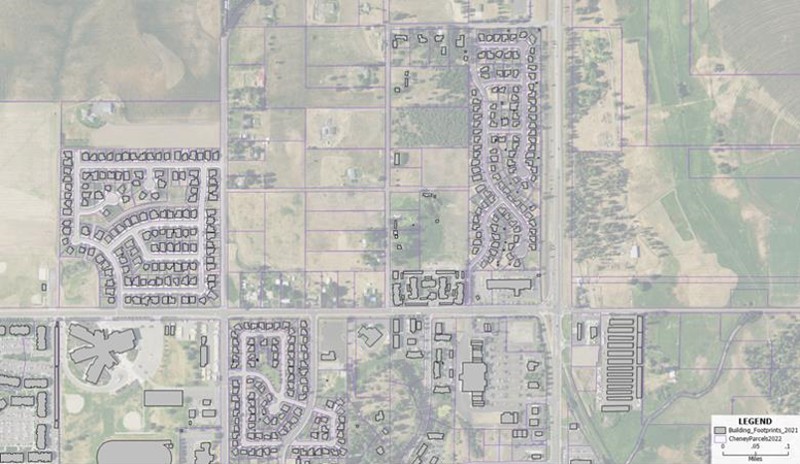
Map 2 – Maptitude Workspace – Study Area with aerial imagery turned on.
- Choose Dataview > Table > Modify to add some new fields to
your zoning layer. Add a new field called Zoning (10 characters)
and a second field called Zoning Description (50 characters).
Change the field type to “character.”
- Turn on the “Layer Editing Toolbar” by clicking on
Tools >
Editing > Layer Editing Toolbar.
- Next select “add boundary edge” between where you might have
two different zoning designations, add the line on the map, and
then click on the “green light” icon in the “Layer Editing
Toolbar.” At this point your workspace should look something
like Map 3.
Map 3 – Maptitude Workspace – Study Area.
- Next, click on one of the new
zoning areas using the “Info” icon. A “Dataview” dialogue box
will appear. Scroll down to the end and fill in the blank fields
with relevant information for your project. Your dialogue box
should look something like the one shown in Figure 1.
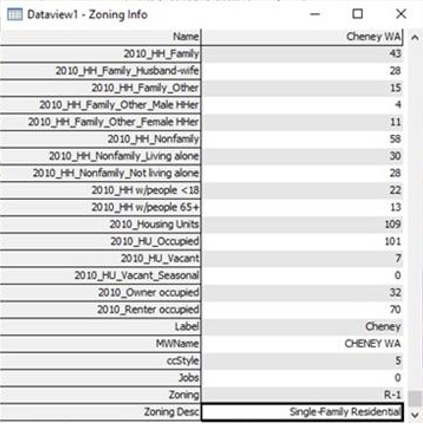
Figure 1 – Information box with the zoning and Zoning Description fields filled in.
- Next start adding in additional boundary lines for your
community. As polygons start filling in, edit the “Dataview”
dialogue box for other residential, commercial and industrial
areas.
- Once you have clicked on other polygons with the “Info”
icon, and filled in the requisite zoning information, one can
create a thematic/color theme map. To create thematic map, click
on the “Color Theme MapWizard.” A new dialogue box will appear.
Follow the prompts to assign different colors to residential,
commercial and industrial areas. At this point your workspace
should look something like Map 4.
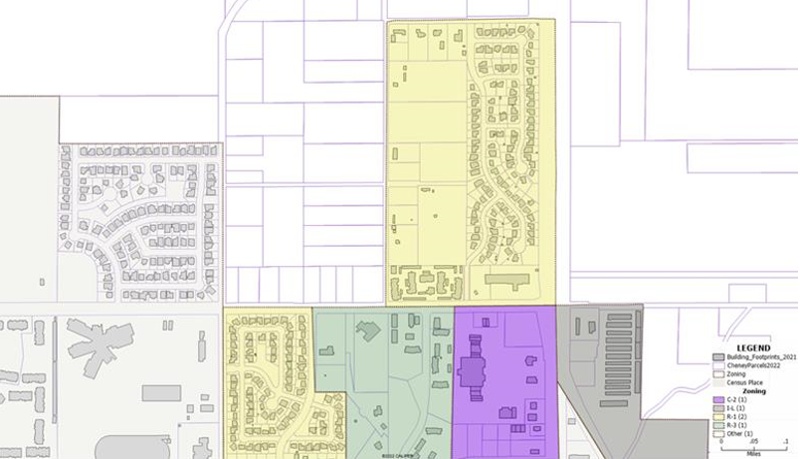
Map 4 – Maptitude Workspace showing different zoning districts as a color thematic map.
Conclusion
Once completed, you will have a zoning map for the community. The
map can be saved as a pdf or jpg to be shared as a static map on a
website, or it could be printed out poster size. Maps created within
the desktop environment can also be uploaded and turned into an
online interactive map via the Maptitude Online portal.
Maptitude
is an extremely powerful software package for municipal governments
for planning/zoning. For example, it allows adding additional fields
to analyze household data for Blocks or Block Groups at the Zoning
Designation level.
Next Steps
Learn more about Maptitude to see how you and your team can benefit from mapping software!
Schedule a Free Personalized Demo
Free Trial Buy Now