GIS for Local Government: Public Safety


Authors:
Brett Lucas
and Stewart Berry
Introduction
This article explores how to use
GIS in local or Municipal Government. Many local governments are
being asked to have a more transparent relationship with their
citizens, which has been supported by technologies like
geographic information systems (GIS) and other data
visualization tools which allows communities to manipulate, analyze,
and present data in a geographic form. GIS as a tool, can help local
government decision-makers, policymakers, and others visualize data
for a variety of applications.
This could include:
- Analyze crime patterns, assess public safety risk, and identify areas of concern.
- Create maps to visualize and monitor changes in crime and emergency response.
- Identify potential areas of public safety risk and plan for emergency response.
- Examine how proposed changes in development or infrastructure might affect public safety.
As a local government, utilizing GIS can help you better
communicate that data through a visual component. Many local
governments have found ways to leverage geospatial data across an
organization in areas like building permit inspections, code
enforcement, and street repair.
GIS Software for Government
Maptitude mapping software is an ideal software platform
for local governments (especially smaller municipalities on a tight
budget at only $795) to leverage geospatial data across an
organization. Maptitude is a full featured desktop or
online GIS and
mapping software that gives you the tools, maps, and demographic
data to analyze and understand how geography affects you and your
community.
In this article we will demonstrate an application of Maptitude
in the municipal government sector for
public
safety mapping.
Public Safety – Mapping Income and
Robberies
For this example, we will be using the City of Seattle, WA (USA).
The city’s police department has downloadable crime data for the
past 15 years in CSV file format, which can be opened in Excel.
Because the file is large, you could edit the data to remove rows
(years) or columns (variables) that are not of interest.
-
Download a free mapping software trial of Maptitude Desktop
or use your existing Maptitude Desktop license.
- Start Maptitude and select "New
Map of my data/table/spreadsheet." Choose the .csv or .xlsx file
that you
downloaded from the Seattle Government web site.
- When going through the "Create a
MapWizard" steps, choose to map your data by latitude/longitude.
The result will resemble Map 1. Alternatively, if your data is
structured by address, you can pin-map the locations using the
built-in geocoder in Maptitude.
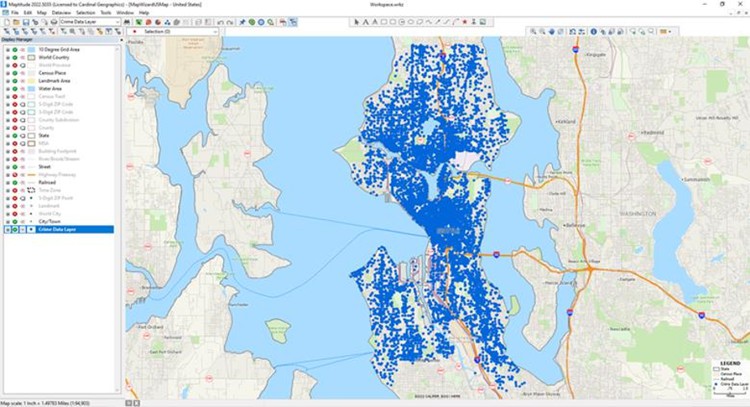
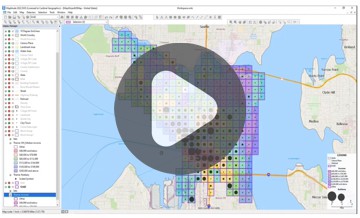
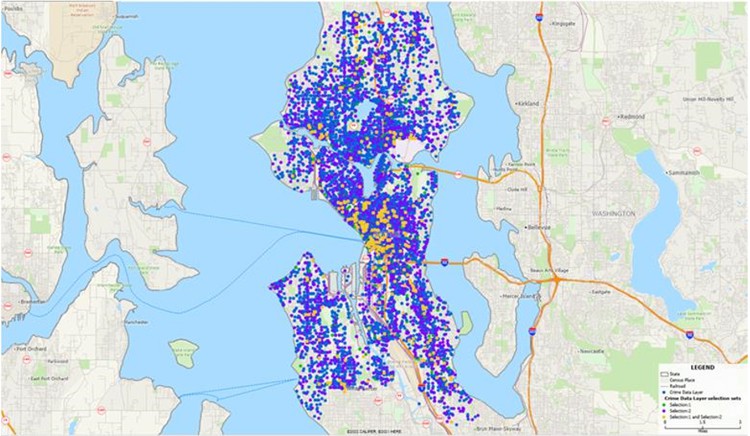
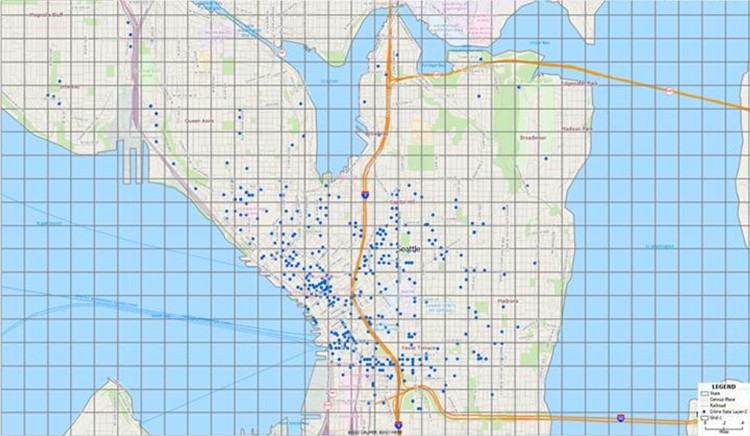
Map 1: Maptitude Workspace showing crime locations
- We are interested in robberies
that occurred during the last third of 2022. The easiest way to
filter for this time period is by using "selection sets". Using
the "Selection
Toolbar," create two new selection sets. For "Selection:1"
use "Select by Condition", and type: [Offence Parent Group] =
"ROBBERY" (Figure 1). Once that is done, and using
"Selection:2", select by condition by typing (or by choosing
from the drop-downs): Date between "9/1/2022" and "12/31/2022".
The result will resemble Map 2.
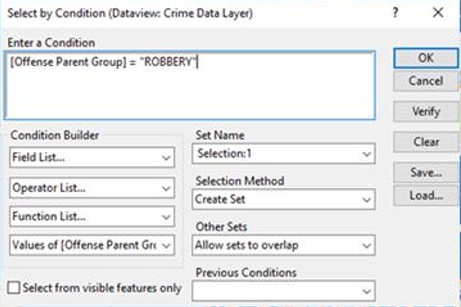
Figure 1: Select by Condition dialogue box
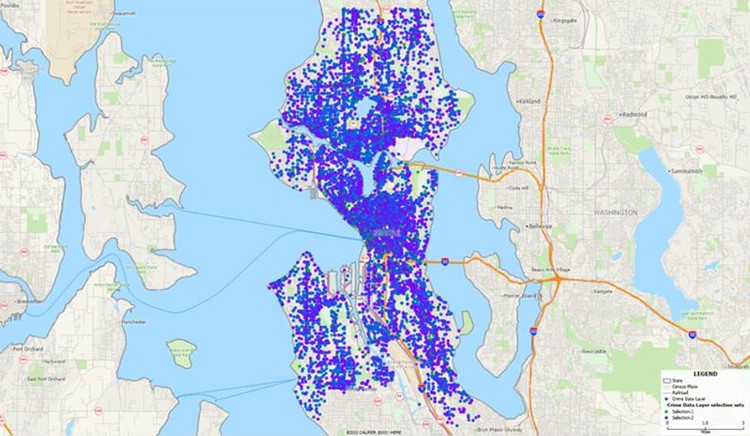
Map 2: Maptitude Workspace showing crime locations, with sets on robberies and by date
- We want:
[Offence Parent Group] = "ROBBERY" AND (Date between "9/1/2022" and "12/31/2022")
We could run this as a single Select by Condition. Instead, we
will combine selection sets, using Selection > Combine Selection
as shown in Figure 2. The result will resemble Map 3.
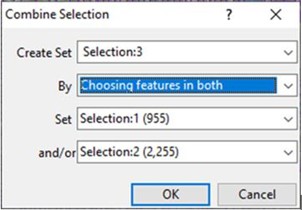
Figure 2: Combine Selection
Map 3: Maptitude Workspace showing crime locations, with the combined selection set (locations in yellow)
- To better visualize the combined
selection set we will want to create a heat (density or hot
spot) map. Make "Crime Data Layer" the working layer. To create
a heat map, choose the "Create Density Grids" button. When
prompted, choose "Crime Data Layer", for Layer.
For Set, choose "Selection:3". For settings,
choose a radius of "0.5 miles" and a Cell Width of "0.02." Click
"OK". A heat map will be created. To better visualize the heat
map, turn off the "Crime Data Layer" in the Display Manager. The
result should resemble Map 4. This map shows that the highest
concentrations of robberies between 9/1/22 and 12/31/22 are in
downtown Seattle with other concentrations or "hot spots"
throughout the city.
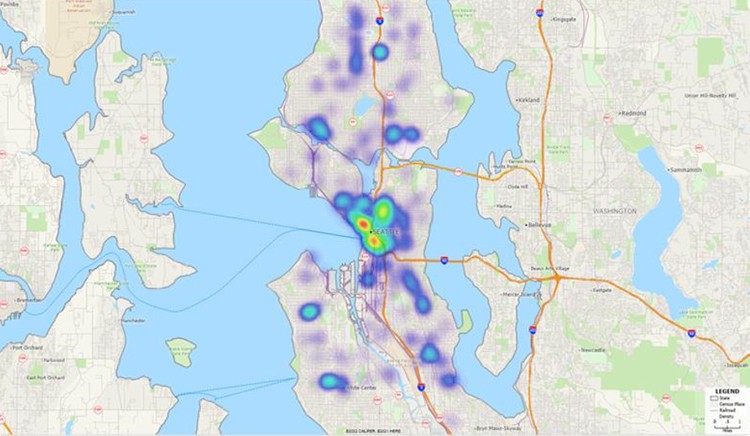
Map 4: Maptitude Workspace showing a "heat map" of crime locations
- Next, we want to assign crime to
a specific geography or defined area such as a Census Block
Group or a grid layer. A grid will keep geography constant. To
do this, turn off the "Density" layer in the Display Manager and
make the "Crime Data Layer" the working layer. Also, zoom into
downtown Seattle, bounded by I-90 on the south and Lake
Washington Ship Canal and Lake Union to the north.
- Create a new selection set "Selection:4". Then choose
Selection > Select by Map Window.
- Combine "Selection:1" (Robberies) and ‘Selection:4"
(geography) into a new set: Selection:5. The result will
resemble Map 5. Use "Selection:5’ via
File > Export > Geography to add a new "Compact
Geographic file" layer to the map called "Crime Data Layer-2".
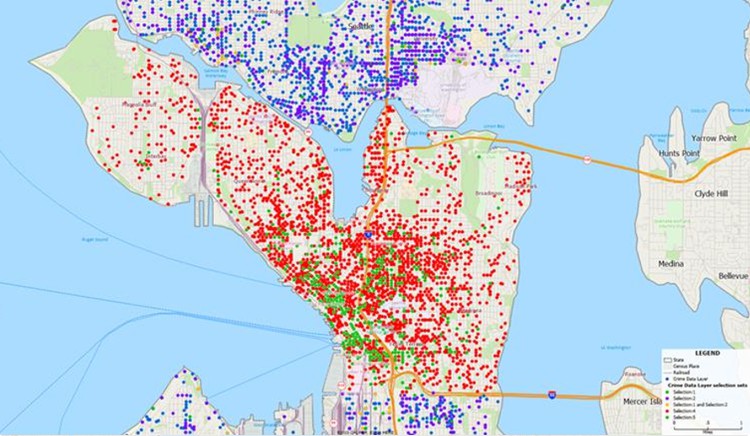
Map 5: Maptitude Workspace showing Selection:5
- To analyze socioeconomic data,
add the "Census Block Group" layer to the map. Maptitude has
this layer available for purchase. Alternatively, you can use
the included Census Tracts.
- To keep geography constant, we
need to create a Grid layer. Use Tools > Editing >
New Grid Layer as shown in Figure 3. Name the
layer "Grid-1". Under "Method" choose "Cover the map window with
cells of a fixed size". For the fixed size (miles), choose 0.25
by 0.25, i.e., quarter mile squares. The result will resemble
Map 6.
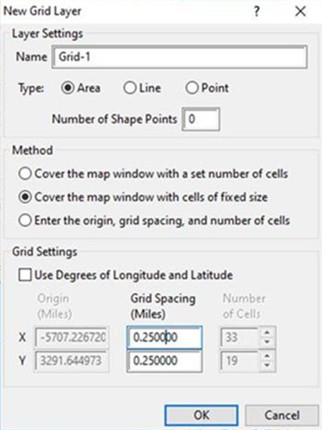
Figure 3: Grid window
Map 6: Maptitude Workspace showing a Grid layer
- Next, we need to add some data to
the new Grid layer. First, we need to modify the table and add a
new field for "Median Household Income" and a field for
"Robberies". To do that, use Dataview > Table >
Modify as shown in Figure 4. Add a new field "Med
HH Inc" and change the format to currency ($1,234) without
decimals. Add a second field "Robberies", and change the format
to number (1,234) without decimals. Click "OK".
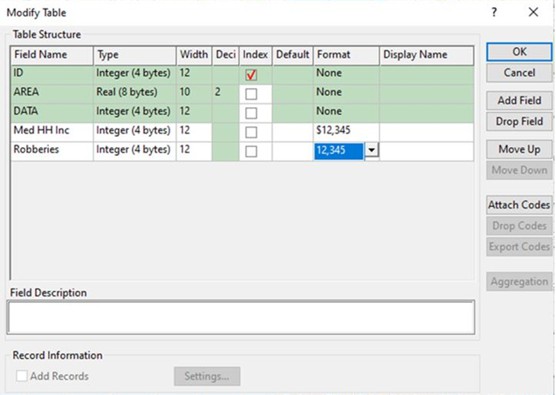
Figure 4: Modify Table window
- Next, we need to overlay some
data. Make sure your "Grid-1" layer is the working layer. Choose
Dataview > New Dataview, and a table
for the layer will open. Right click on the ‘Med HH Inc" column
and choose "Fill". Choose the "Aggregate" radio
button. A new "Aggregate Data" window will appear. For "layer"
choose "Block Group." Under Aggregate Settings, choose "average
of", "[HH Median income]", and the choose "OK". Choose "OK".
Repeat this process for "Robberies" using "Crime Data Layer-2"
and using the Aggregate Settings to fill with "Count".
- Next, we want to create a "Color
Theme" for the cells within the grid, to show lower income and
higher income areas. Choose Map > Thematic Mapping >
Color. For "Field" choose "HH Median income", and
then choose "Optimal Breaks", and choose 5 classes. Choose
"Treat zeros as missing values". Under the Styles tab for
"Other" choose "None" for the Fill Style. Choose a red (lower
income) to purple (higher income) color ramp, with 40% opacity.
The result should resemble Map 7.
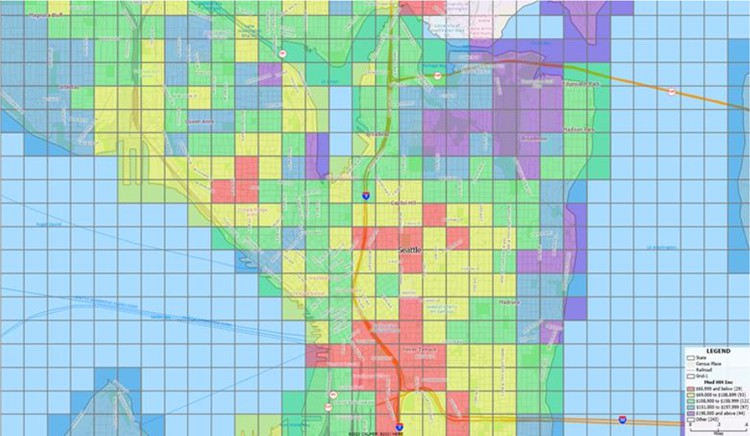
Map 7: Maptitude Workspace showing a grid layer with lower/higher income distribution
- To create a visual correlation
between income and robberies, we want to show robberies as a
graduated symbol theme. Make "Grid-1" the working layer. Choose
Map > Thematic Mapping > Size. For
Field choose "Robberies". Choose "Use perceptual scaling". On
the Style tab, choose black for Color, and choose "Prevent
overlapping labels". Click "OK". The result will resemble Map 8
with graduated symbols.
Map 8: Maptitude Workspace showing a grid layer with an income distribution and graduated symbols
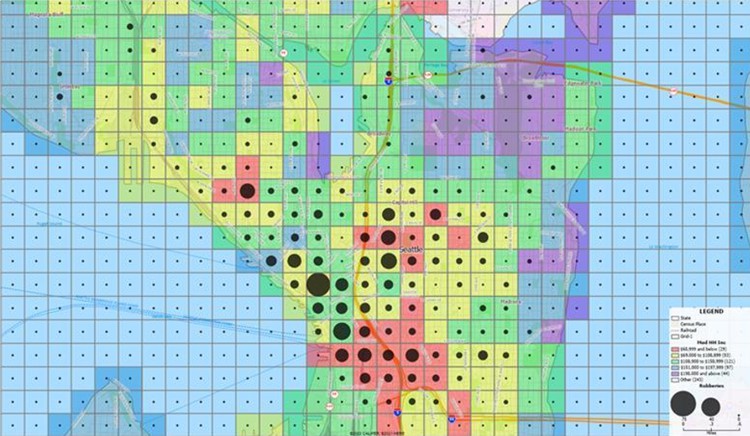
- To exclude data that falls into
water areas, choose Map > Thematic Mapping > Size.
Under Symbol Sizes, choose a Low Value of 1 with Size 4, and a
High Value of 65 with Size 30. The result will resemble Map 9.
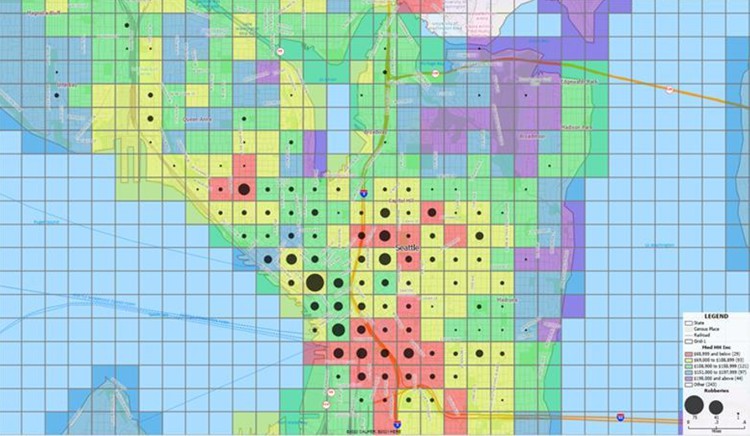
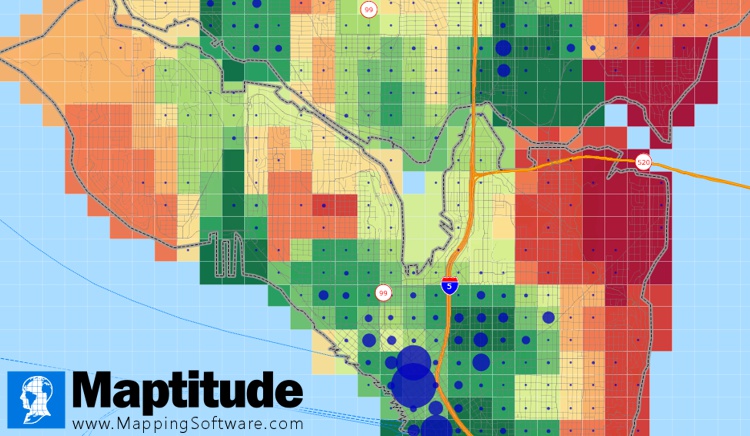
Map 9: Maptitude Workspace showing a grid layer with an income distribution and graduated symbols sized appropriately
Conclusion
After reviewing Map 9, one can see higher amounts of robberies in
cells that are colored red and yellow, which tend to be lower income
areas. While this visual approach is not as precise as performing a
regression, it does provide one with a useful visual correlation
between income and robberies.
Maptitude is an extremely powerful software package for municipal
governments for public safety. For example, law enforcement could
use the results of such an analysis to better deploy police
resources to select geographies where crime activity is occurring.
Next Steps
Learn more about Maptitude to see how you and your team can benefit from mapping software!
Schedule a Free Personalized Demo
Free Trial Buy Now