Last Updated: March 5, 2025
You can map Construction Valuation using real estate mapping software.
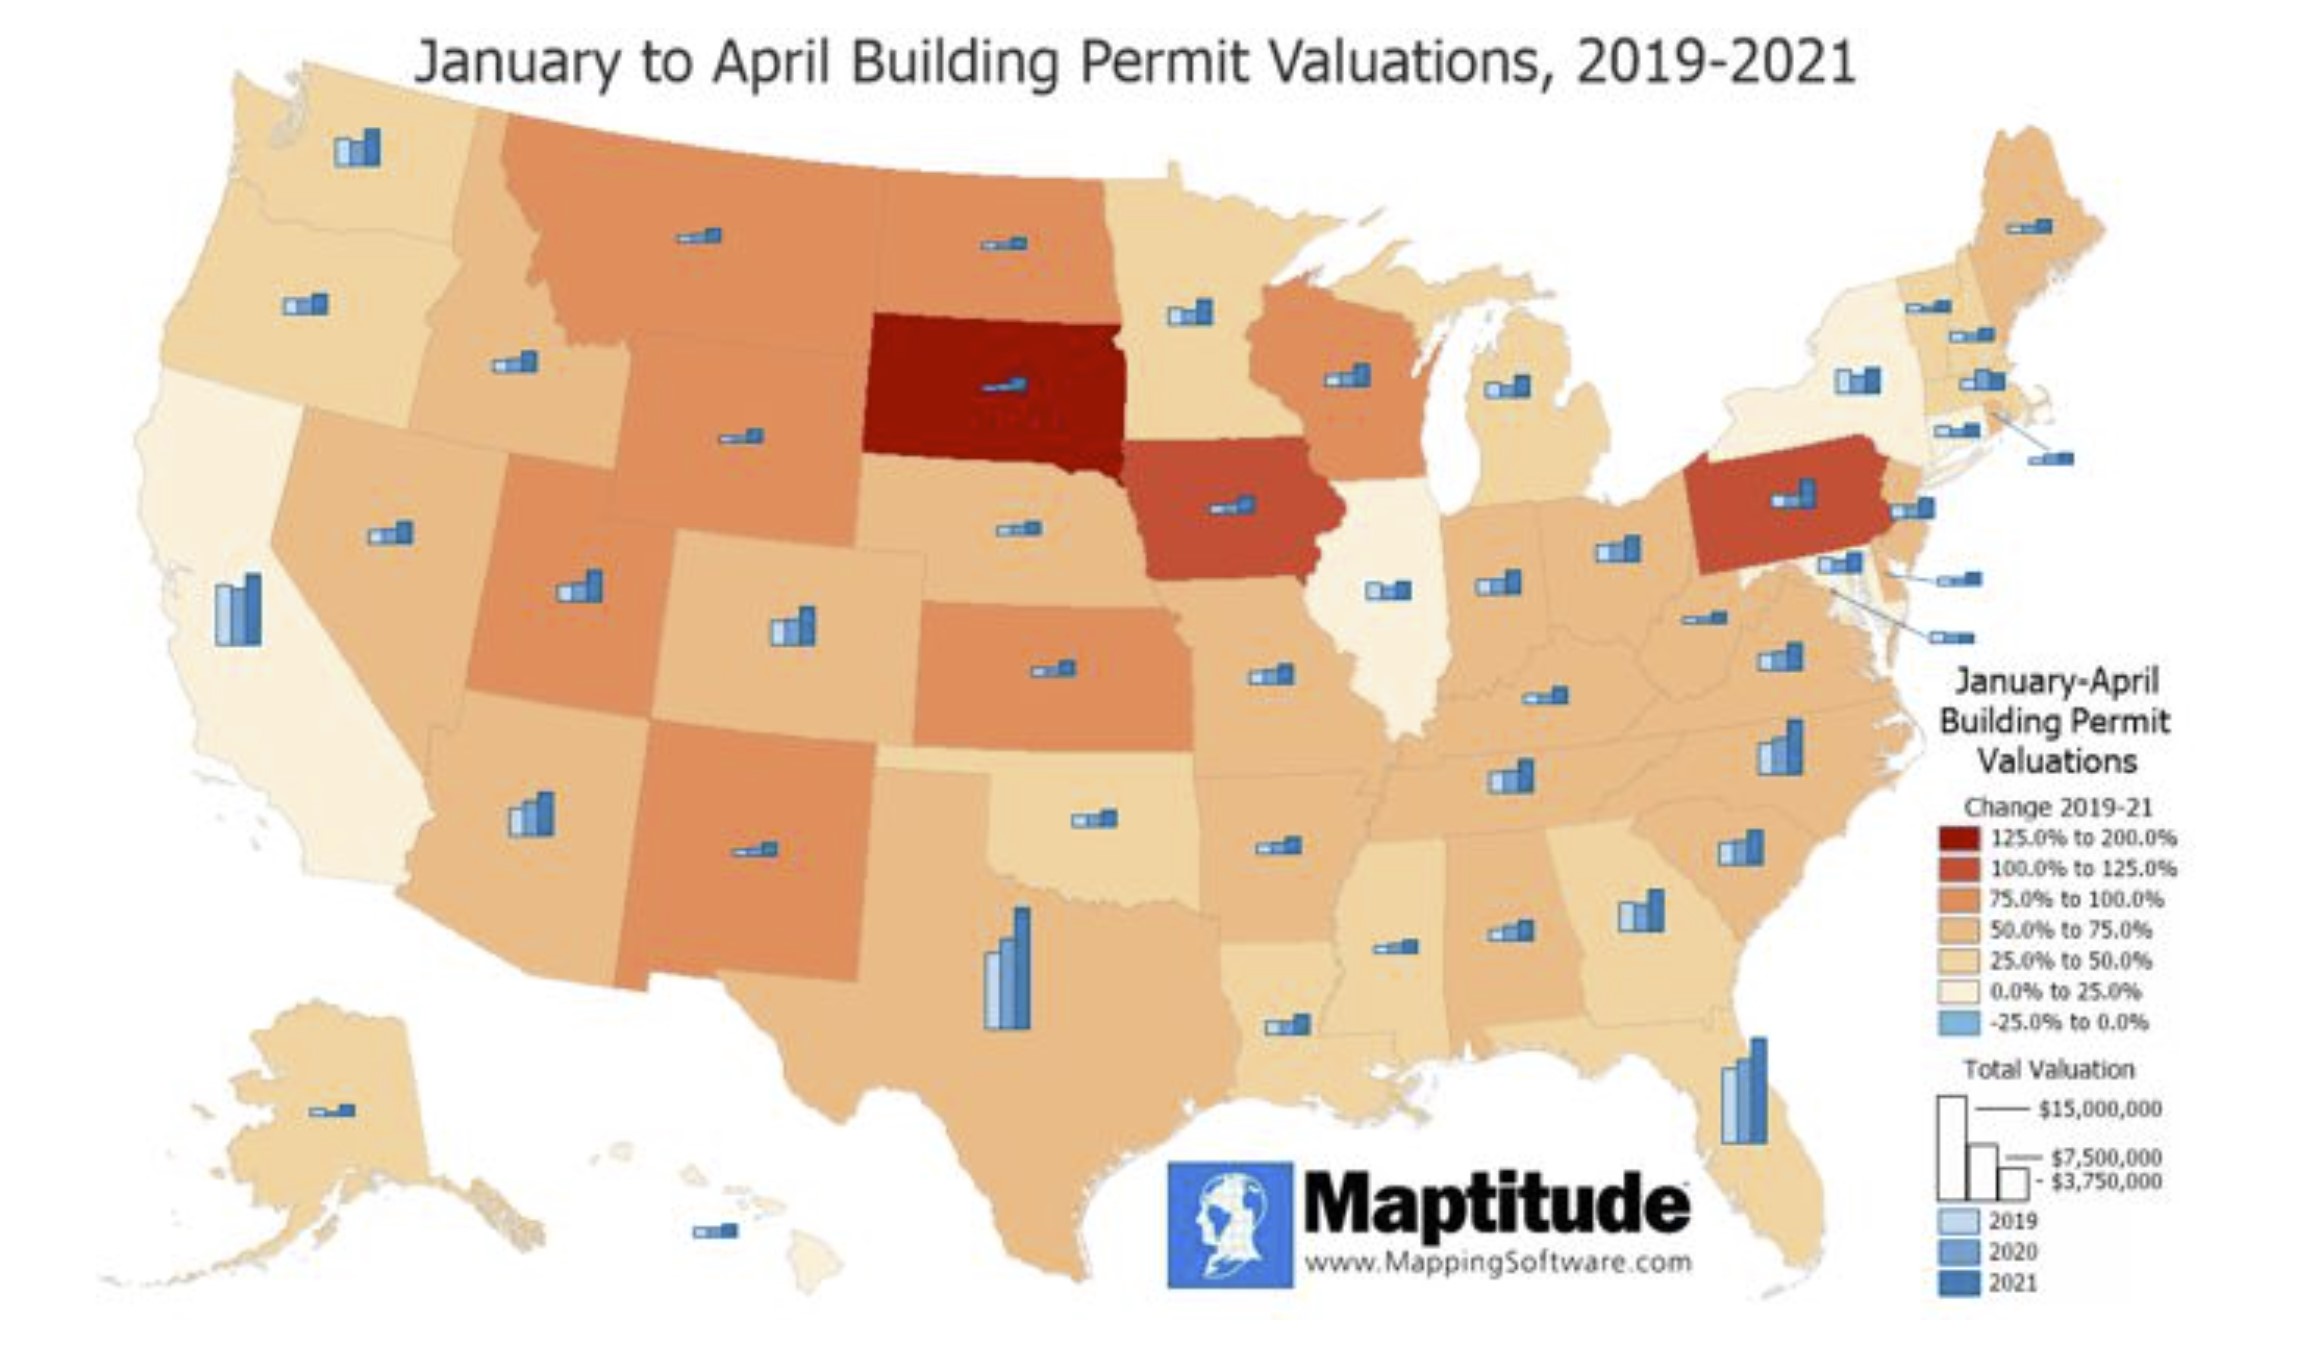
Maptitude can directly map data from the Census Bureau Building Permits Survey. The construction valuation is the estimated value of the residential structure as shown on the building permit or estimated by the permit official. The data covers building permit statistics on new privately-owned residential construction. Of those properties being built the total valuations are dramatically higher than even 2 years ago.
We map this data below using Maptitude to compare the January-April building permit valuations for 2019-2021. Building permit valuations are up from 2019 levels in every state, though down in the District of Columbia (-6.1%). The heat map shows that 31 states had building permit valuations go up at least 50% compared to 2019, and that the valuations more than doubled in South Dakota (177.9%), Iowa (107.7%), and Pennsylvania (101.9%).
The map charts show that 19 states saw a decline in the first four months of 2020 as compared to 2019. Massachusetts saw the largest increase in 2020 despite two months of pandemic and was the only state to see a decline in building permit valuations from 2020 to 2021.
You can map data like this yourself using one or more of the thematic mapping tools in the software.
For how to bring your own data such as this into Maptitude, see the Maptitude tutorial video on creating a map with your own data.