GIS for Local Government: Public Works


Authors:
Brett Lucas
and Stewart Berry
Introduction
This article explores how to use
GIS in local or Municipal Government. Many local governments are
being asked to have a more transparent relationship with their
citizens, which has been supported by technologies like
geographic information systems (GIS) and other data
visualization tools which allows communities to manipulate, analyze,
and present data in a geographic form. GIS as a tool, can help local
government decision-makers, policymakers, and others visualize data
for a variety of applications.
This could include:
- Constructing and managing road networks
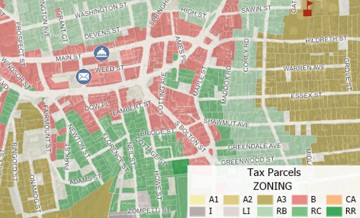
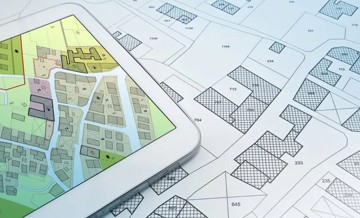
- Analyzing land use for infrastructure planning
- Identifying areas for waste disposal and stormwater management
- Analyzing environmental conditions
- Tracking assets for maintenance and repair
As a local government, utilizing GIS can help you better
communicate that data through a visual component. Many local
governments have found ways to leverage geospatial data across an
organization in areas like building permit inspections, code
enforcement, and street repair.
GIS Software for Government
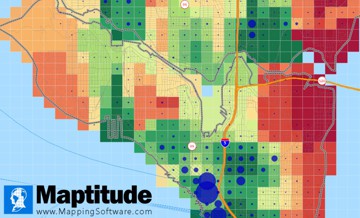
Maptitude mapping software is an ideal software platform
for local governments (especially smaller municipalities on a tight
budget at only $795) to leverage geospatial data across an
organization. Maptitude is a full featured desktop or online GIS and
mapping software that gives you the tools, maps, and demographic
data to analyze and understand how geography affects you and your
community.
In this article we will demonstrate an application of Maptitude
in the municipal government sector for public works.
Public Works – How to add utility lines to a map
For this example, we will be using the City of Perry, Iowa. Perry
is a town of 7,000 people located approximately 16 miles to the
northwest of Des Moines. One of the features that makes Maptitude so
ideal for this task is that when the
United States County Package is used, several different aerial
imagery layers are available. These are a great beginning point for
creating the geography of water and sewer lines as we demonstrate in
the following steps.
-
Download a free mapping software trial of Maptitude Desktop
or use your existing Maptitude Desktop license.
- Start Maptitude, and choose "New
Map of United States", click OK, choose "U.S.
City", type "Perry, IA", and click Finish. A
map zoomed into Perry Iowa is displayed.
- Next, you may want to
turn on some aerial photography (three choices are available
in Maptitude) to aid in creating a utility layer. I recommend
setting the opacity to 50%. Zoom into your area of interest. The
result should resemble Map 1.
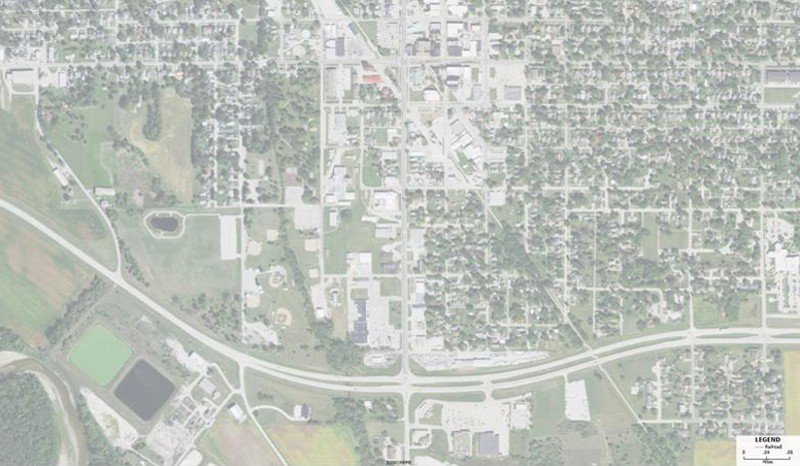
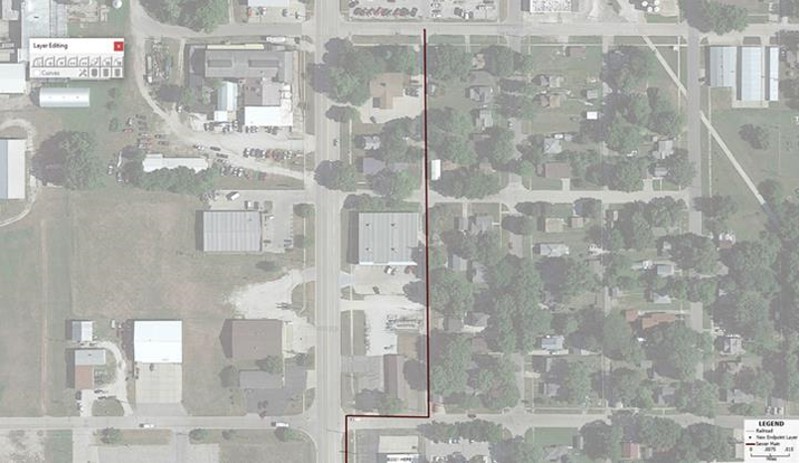
Map 1: Maptitude map showing the study area
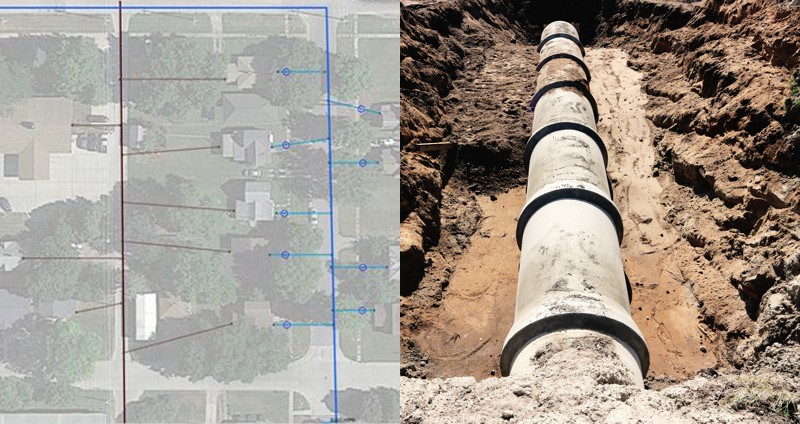
- Now, we want to add some sewer
mains that go from the wastewater treatment plant to one of the
neighborhoods located southwest of downtown. To map sewer lines,
we need to create a new line layer. To do that, click on
Tools > Editing > New Layer. A new window will
appear. Within the window choose the radio button for "Line
Layer". Name the new layer "Sewer Main". choose the radio button
to "Add the layer to the current map window". Click OK.
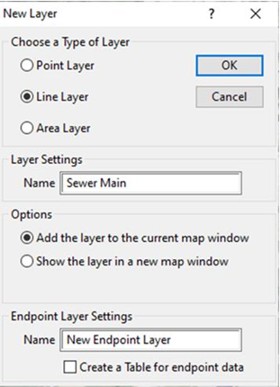
Figure 1: New Layer window
- Next, in the Display Manager
(normally docked to the left of the Maptitude screen), click the
style icon for the "Sewer Main" layer and change the line width
to 2 and the color to brown. When mapping public works data,
sewer lines are generally mapped in green or brown, and water is
generally mapped in blue. Reclaimed water is generally mapped in
purple.
- Now would be a good time to
modify the layer and add some fields to describe our Sewer Main.
Choose Dataview > Table > Modify to
add some new fields to your line layer. Add a new field called
"Pipe Type" (20 characters) and a second field called "Pipe
Size" (2 characters). For Pipe Type, change the field type to
"character", and for Pipe Size, change the filed type to
"Integer". Once the changes are made, click OK.
The result will resemble Figure 2.
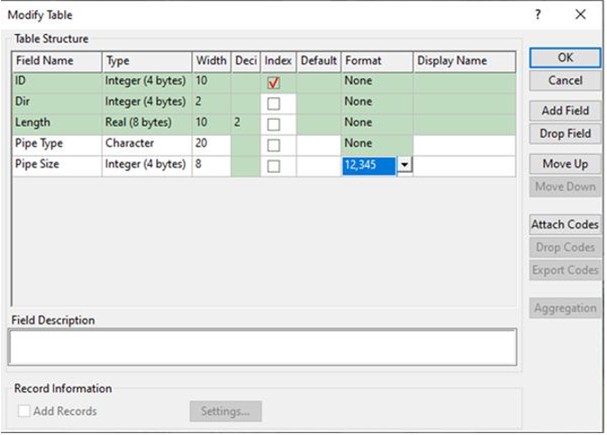
Figure 2: Modify Table window
- With "Sewer Main" as your
Working Layer, if not already open, open the "Layer Editing
Toolbar" by clicking on Tools > Editing > Layer Editing Toolbar.
Next, choose the "Add line" button and start laying out your
sewer main on your Maptitude map. Once you have added a line on
the map, click on the "green light" button. The result will
resemble Map 2.
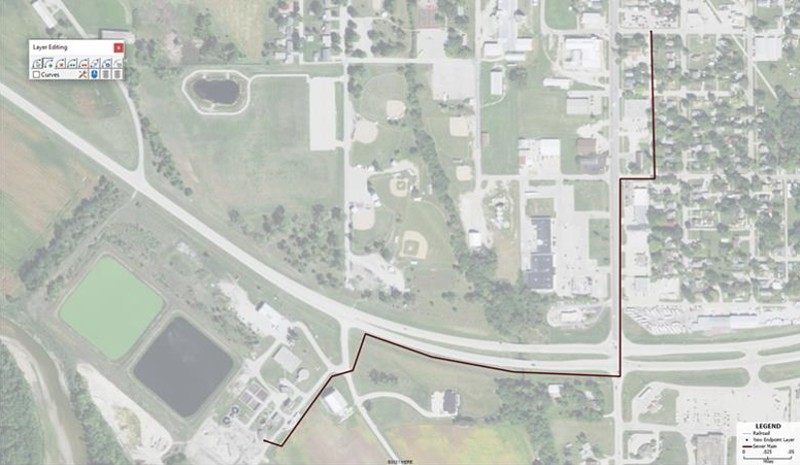
Map 2: Maptitude map showing the sewer main from the wastewater treatment plant
- Next, we need to zoom in and edit
the location of the sewer main (to make sure it is in the middle
of the alley) within the neighborhood located in the northeast
portion of the map. Going back to the "Layer Editing Toolbar",
click on the "Modify line" button to edit the location of the
sewer main. Click on the line you wish to edit. Some square
"shape points" will appear, and you interactively use those to
modify the location of the line. Once done, click on the "green
light" button to commit the changes.
Map 3: Maptitude map showing with edited Sewer Main location in alley
- With "Sewer Main" as your Working
Layer, click on the "Edit line attributes" button on the
toolbar, and then click on the sewer main in the neighborhood. A
new window will appear for the Dataview. Here we can edit the
information in the two new fields that we recently created. In
the "Pipe Type" field, enter the word "Ductile Iron". In the
Pipe Size field enter "8" for 8-inch diameter. The result will
resemble Figure 3.
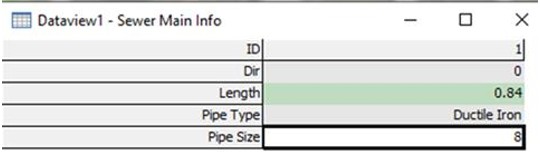
Figure 3: Info window
- Now we need to add some sewer
laterals from the sewer main to the back of each of the houses.
We will create a new layer called "Sewer Lateral". To do this,
choose on Tools > Editing > New Layer.
A new window will appear. Within the window, choose the radio
button for "Line Layer". Name the new layer "Sewer Lateral".
Choose to "Add the layer to the current map window". In the
Display Manager, make the "Sewer Main" layer the Working Layer,
and change the line width to 1.5 or 2 and the color to light
brown. You may also want to open the Dataview (Dataview
> New Dataview) for the layer and use Modify Table
to add fields to describe the sewer lateral (e.g., install date,
material, size, etc.).
- With "Sewer Lateral" as your
Working Layer, open on the "Layer Editing Toolbar" by clicking
on Tools > Editing > Layer Editing Toolbar.
Choose the "Add line" button
and start laying out your sewer laterals on your Maptitude map.
Add the lines to the map and then click on the "green light"
button. The result will resemble Map 4.
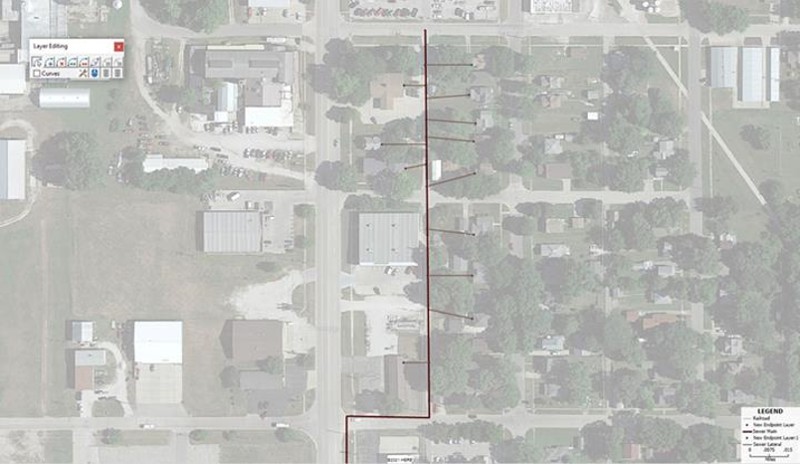
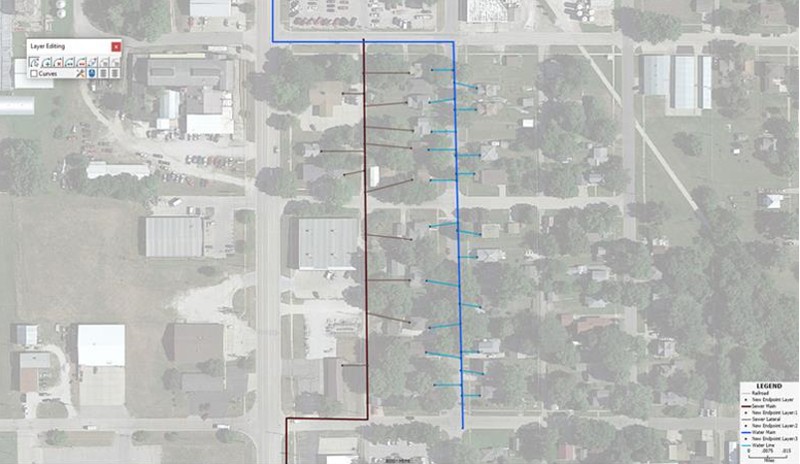
Map 4: Maptitude map showing the sewer laterals off of the sewer main in the alley
- Now we need to add some water
mains from the water works facility to the neighborhood. Unlike
sewer mains which are generally located in the alley, water
mains are usually located in the street in front of the house.
We will create a new layer called "Water Main". To do this,
click on Tools > Editing > New Layer.
A new window will appear. Within the window choose the radio
button for "Line Layer". Name the new layer "Water Main". Choose
to "Add the layer to the current map window". In the Display
Manager, make the "Water Main" layer the Working Layer, and
change the line width to 2 and the color to medium or dark blue.
You may also want to open the Dataview (Dataview >
New Dataview) for the layer and use Modify Table
to add fields to describe the water main (e.g., install date,
material, size, etc.). The result will resemble Map 5.
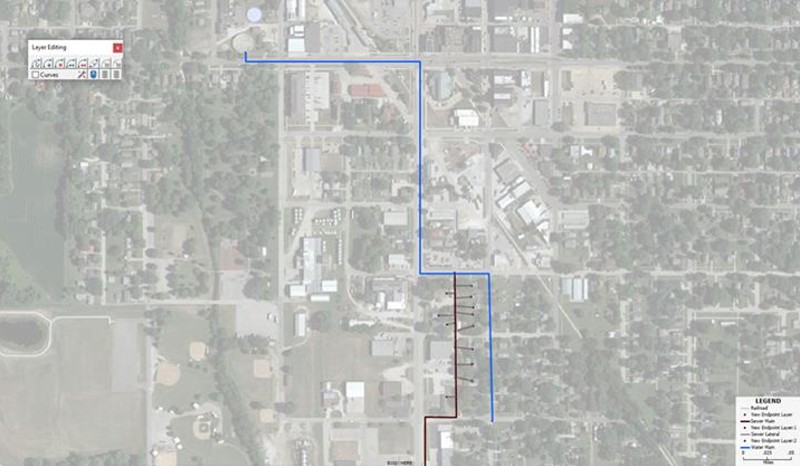
Map 5: Maptitude map showing the water main from the water works facility
- This would be a good time to
modify the layer and add some fields to describe our Water Main.
choose Dataview > Table > Modify to
add some new fields to your line layer. Add a new field called
"Pipe Type" (20 characters) and a second field called "Pipe
Size" (2 characters). For Pipe Type, change the field type to
"character", and for Pipe Size, change the filed type to
"integer". Once the changes are made, click OK.
- Next, we will want to zoom back
into the neighborhood where the sewer laterals are located. If
need be, now is a good time to edit/modify the line location of
the water main.
- Next, create a new layer called
"Water Lines". In the Display Manager, make the "Water Line"
layer the working layer, and change the line width to 1.5 and
the color to light or medium. You may also want to open the
Dataview (Dataview > New Dataview) for
the layer and use Modify Table to add fields to describe the
water line (e.g., install date, material, size, etc.). The
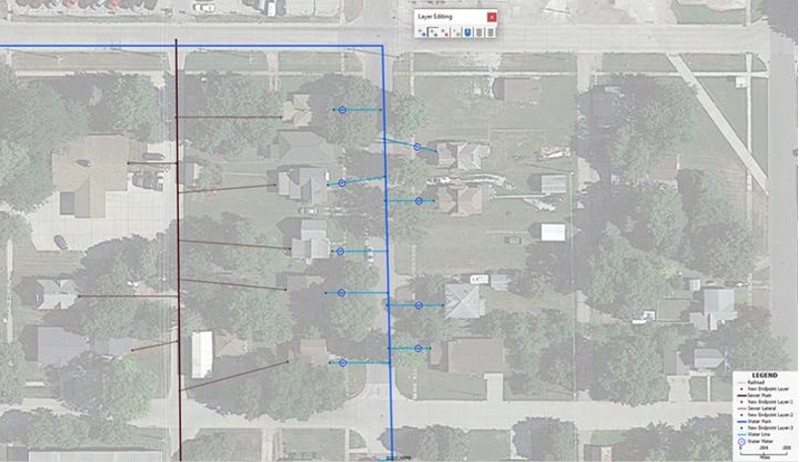
result will resemble Map 6.
Map 6: Maptitude map showing the water lines going to each
- Now with all our sewer and water
line infrastructure laid out, we need to add water meters. First
zoom into the neighborhood, so we can see the sidewalks.
- We will create a new layer called
"Water Meter". To do this, click on Tools > Editing
> New Layer. Within the window, choose the radio
button for "Point Layer". Name the new layer "Water Meter".
Choose to Add the layer to the current map window". In the
Display Manager, make "Water Meter" the Working Layer. Edit the
layer style by choosing a hexagon with a dot in the middle. Make
the size 12 and blue. You may also want to open the Dataview (Dataview
> New Dataview) for the layer and use Modify Table
to add fields to describe the water meter (e.g., date of
installation, ID or ERT (encoder receiver transmitter), etc.).
The Style window will look like Figure 4.
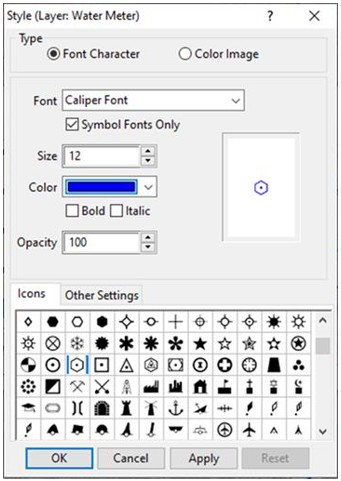
Figure 4: Style window
- With "Water Meter" as your
Working Layer, open the "Layer Editing Toolbar". Next, choose
the "Add point" button and start laying out water meters on your
Maptitude map. Add the points on the map, and then click the
"green light" button. The result will resemble Map 7.
Map 7: Maptitude map showing the water meters in front of each home
- With the Water Meter layer as the
Working Layer, click on the "Edit Point Attributes" button and
edit the data in the water meter fields. For the "Install Date"
a drop-down calendar will appear. The "ERT Number" has been set
up as an 8-digit number to fill in. The result will resemble Map
8, with the Water Meter layer Info window shown.
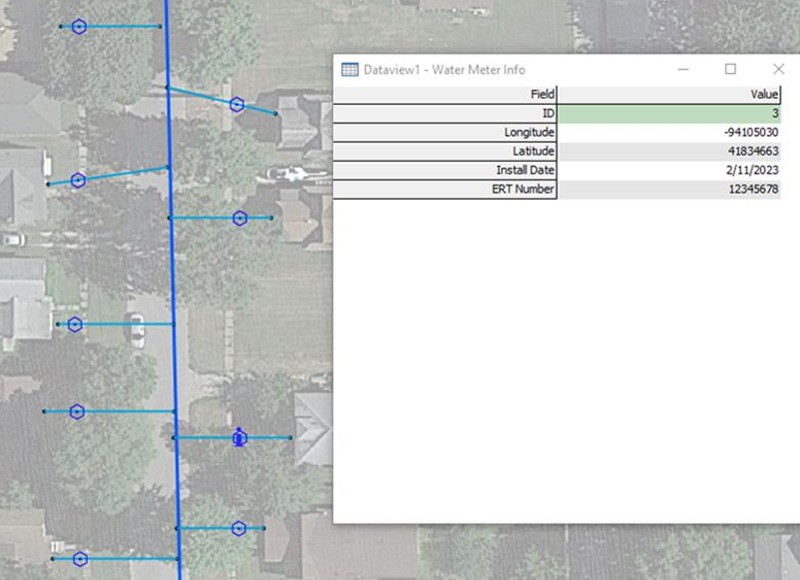
Map 8: Maptitude map showing with water meters and the Water Meter layer Info window
Conclusion
Once completed, you will have a utilities map for the community.
The
map can be saved as a pdf or jpg to be shared as a static map on
a website, or it could be
printed out to poster size. Maps created within the desktop
environment can also be uploaded and turned into an online
interactive map via the
Maptitude Online portal.
Maptitude is an extremely powerful software package for municipal
governments for public works. For example, water crews could use the
results of such an analysis to better determine where leaks are
occurring based on the age of the pipe.
Next Steps
Learn more about Maptitude to see how you and your team can benefit from mapping software!
Schedule a Free Personalized Demo
Free Trial Buy Now